

takasuu
VONV strategy and portfolio
This dividend exchange-traded fund (“ETF”) article series aims at evaluating products regarding the relative past performance of their strategies and quality of their current portfolios. As holdings and their weights change over time, reviews may be updated when necessary.
The Vanguard Russell 1000 Value ETF (NASDAQ:VONV) has been tracking the Russell 1000 Value Index since September 2010. It has 852 holdings, a 12-month distribution yield of 2.11% and a total expense ratio of 0.08%. It is a direct competitor of the iShares Russell 1000 Value ETF (IWD), which tracks the same underlying index. IWD is older, and it has more assets and volume.
|
VONV |
IWD |
|
|
Assets Under Management |
$6.97B |
$53.79B |
|
Avg Daily Volume |
781.26K |
2.99M |
|
Expense Ratio |
0.08% |
0.18% |
|
Inception |
09/20/2010 |
5/22/2000 |
As described by FTSE Russell, the underlying index measures the performance of a large cap segment of the U.S. stock market including companies with lower price-to-book ratios and lower expected growth. It represents about half of the total market value of the Russell 1000 Index.
VONV invests almost exclusively in U.S. companies (98% of asset value), mostly in the large cap segment (67%). As expected, VONV is cheaper than its parent index Russell 1000 (IWB) regarding the usual valuation ratios, as reported in the next table.
|
VONV |
IWB |
|
|
Price / Earnings TTM |
15.09 |
19.85 |
|
Price / Book |
2.25 |
3.65 |
|
Price / Sales |
1.65 |
2.29 |
|
Price / Cash Flow |
11.19 |
14.84 |
Source: Fidelity.
The top 3 sectors are financials (19.4%), healthcare (16.5%) and industrials (12.7%). Other sectors are below 10%. Compared to the Russell 1000, the fund underweights technology, communication, and to a lesser extent consumer discretionary. It overweights all other sectors, especially financials, energy and utilities.
Sector breakdown (chart: author; data: Vanguard)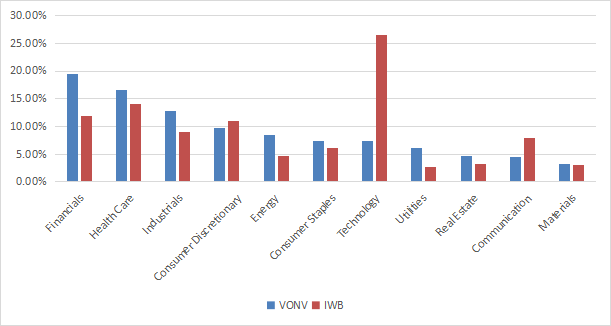
VONV currently holds 852 stocks. The top 10 holdings represent 18.26% of asset value. The next table lists their weights and valuation ratios. Exposure to risks related to any individual stock is moderate (3% maximum).
|
Ticker |
Name |
Weight |
P/E TTM |
P/E fwd |
P/Sales TTM |
P/Book |
P/Net Free CashFlow |
Yield% |
|
Berkshire Hathaway, Inc. |
3.03% |
N/A |
21.29 |
2.30 |
1.49 |
34.15 |
0 |
|
|
Johnson & Johnson |
2.53% |
24.43 |
15.66 |
4.59 |
5.85 |
70.13 |
2.75 |
|
|
Exxon Mobil Corp. |
2.47% |
8.42 |
10.31 |
1.15 |
2.37 |
10.66 |
3.25 |
|
|
JPMorgan Chase & Co. |
2.13% |
11.67 |
10.86 |
2.66 |
1.58 |
5.32 |
2.84 |
|
|
Chevron Corp. |
1.89% |
9.28 |
10.86 |
1.37 |
2.04 |
12.28 |
3.56 |
|
|
Pfizer Inc. |
1.57% |
8.05 |
11.09 |
2.52 |
2.73 |
13.75 |
3.72 |
|
|
Bank of America Corp. |
1.26% |
11.43 |
10.46 |
2.56 |
1.21 |
4.23 |
2.42 |
|
|
Meta Platforms, Inc. |
1.16% |
21.73 |
19.53 |
4.22 |
3.92 |
25.86 |
0 |
|
|
Procter & Gamble Co. |
1.12% |
25.05 |
24.45 |
4.41 |
8.11 |
132.87 |
2.56 |
|
|
Walmart, Inc. |
1.10% |
43.79 |
23.36 |
0.64 |
5.32 |
434.59 |
1.58 |
Ratios: Portfolio123.
VONV and IWD, which track the same index, have almost identical annualized returns since VONV’s inception (10.91% vs. 10.88%). Hereafter, IWD historical data will be used to assess the index on a longer period.
Since 5/29/2000, IWD is very close to the parent index Russell 1000 in performance and risk metrics.
|
since May 2000 |
Total Return |
Annual.Return |
Drawdown |
Sharpe ratio |
Volatility |
|
IWD |
373.53% |
7.09% |
-60.10% |
0.42 |
15.46% |
|
IWB |
356.84% |
6.92% |
-55.38% |
0.41 |
15.73% |
IWD vs IWB since May 2000 (Portfolio123)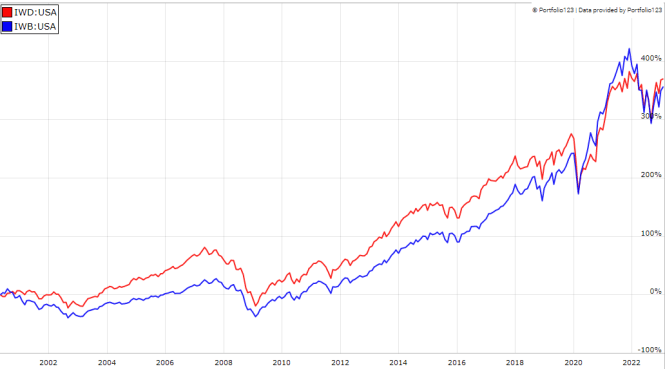
In the last 12 months, VONV has beaten its parent index by about 7 percentage points. However, it has lagged a number of large cap value funds: ETFs tracking the S&P 500 Value Index (IVE, SPYV), the First Trust Large Cap Value AlphaDEX Fund (FTA), and the Avantis U.S. Large Cap Value ETF (AVLV).
VONV vs IWB and value ETFs, last 12 months (Portfolio123)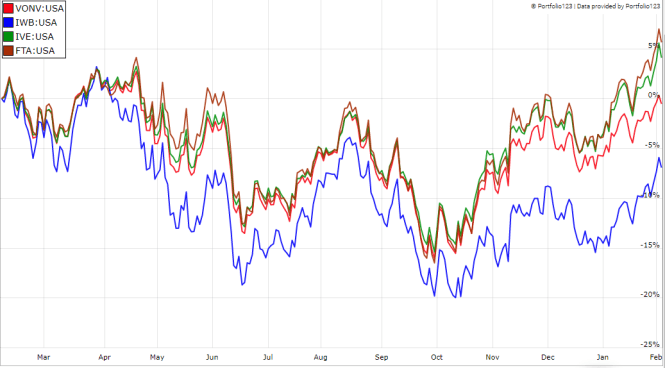
Comparing VONV with my Dashboard List model
The Dashboard List is a list of 80 stocks in the S&P 1500 index, updated every month based on a simple quantitative methodology. All stocks in the Dashboard List are cheaper than their respective industry median in Price/Earnings, Price/Sales and Price/Free Cash Flow. After this filter, the 10 companies with the highest Return on Equity in every sector are kept in the list. Some sectors are grouped together: energy with materials, communication with technology. Real estate is excluded because these valuation metrics don’t work well in this sector. I have been updating the Dashboard List every month on Seeking Alpha since December 2015, first in free-access articles, then in Quantitative Risk & Value.
The next table compares the Russell 1000 Value Index since 2000 with the Dashboard List model, with a tweak: the list is reconstituted annually instead of once a month to make it comparable to a passive index.
|
since May 2000 |
Total Return |
Annual.Return |
Drawdown |
Sharpe ratio |
Volatility |
|
Russell 1000 Value Index (IWD) |
373.53% |
7.09% |
-60.10% |
0.42 |
15.46% |
|
Dashboard List (annual) |
1072.55% |
11.46% |
-56.41% |
0.62 |
17.39% |
Past performance is not a guarantee of future returns. Data Source: Portfolio123.
The Dashboard List outperforms the Russell 1000 Value Index by 4.4 percentage points in annualized return. However, IWD price history is real and the model is simulated.
Price to Book: a risky concept of value
Most value ETFs have two shortcomings in my opinion, and this one is no exception. The first one is to rank stocks as if valuation ratios were comparable across all sectors. Obviously they are not: you can read my monthly dashboard here to go deeper into this topic. It results in overweighting financials, whose valuations are naturally cheaper. Some other sectors are disadvantaged, especially technology.
The second issue comes from the price/book ratio (P/B), which adds some risk in the strategy. Historical data show that a large group of companies with low P/B has a higher probability to hold value traps than a same-size group with low price/earnings, price/sales or price/free cash flow. Statistically, such a group will also have a higher volatility and deeper drawdowns in price. The next table shows the return and risk metrics of the cheapest quarter of the S&P 500 (i.e.125 stocks) measured in price/book, price/earnings, price/sales and price/free cash flow. The sets are reconstituted annually between 1/1/2000 and 1/1/2023 with elements in equal weight.
|
Annual.Return |
Drawdown |
Sharpe ratio |
Volatility |
|
|
Cheapest quarter in P/B |
8.54% |
-81.55% |
0.35 |
37.06% |
|
Cheapest quarter in P/E |
10.71% |
-73.62% |
0.48 |
25.01% |
|
Cheapest quarter in P/S |
12.82% |
-76.16% |
0.47 |
34.83% |
|
Cheapest quarter in P/FCF |
15.32% |
-74.77% |
0.61 |
27.03% |
Data calculated with Portfolio123.
This explains why I use P/FCF and not P/B in the Dashboard List model.
Takeaway
Vanguard Russell 1000 Value ETF splits the Russell 1000 index in value and growth subsets using the price/book ratio and several growth metrics, and invests in the value side. VONV has beaten its parent index in the last 12 months, but it has lagged several large cap value ETFs. Moreover, based on two decades of data, the underlying index doesn’t seem to bring excess return over the Russell 1000. Even if it doesn’t look attractive in the long term, VONV may be useful in a tactical allocation strategy switching between value and growth.
I see two reasons why the Russell 1000 Value Index doesn’t outperform its parent index. First, it ranks stocks regardless of their sectors. Second, price/book is a risky factor. An efficient value model should compare stocks in comparable sets and rely on other ratios, like my Dashboard List does.
Be the first to comment