

Tramino
By Robert Hughes
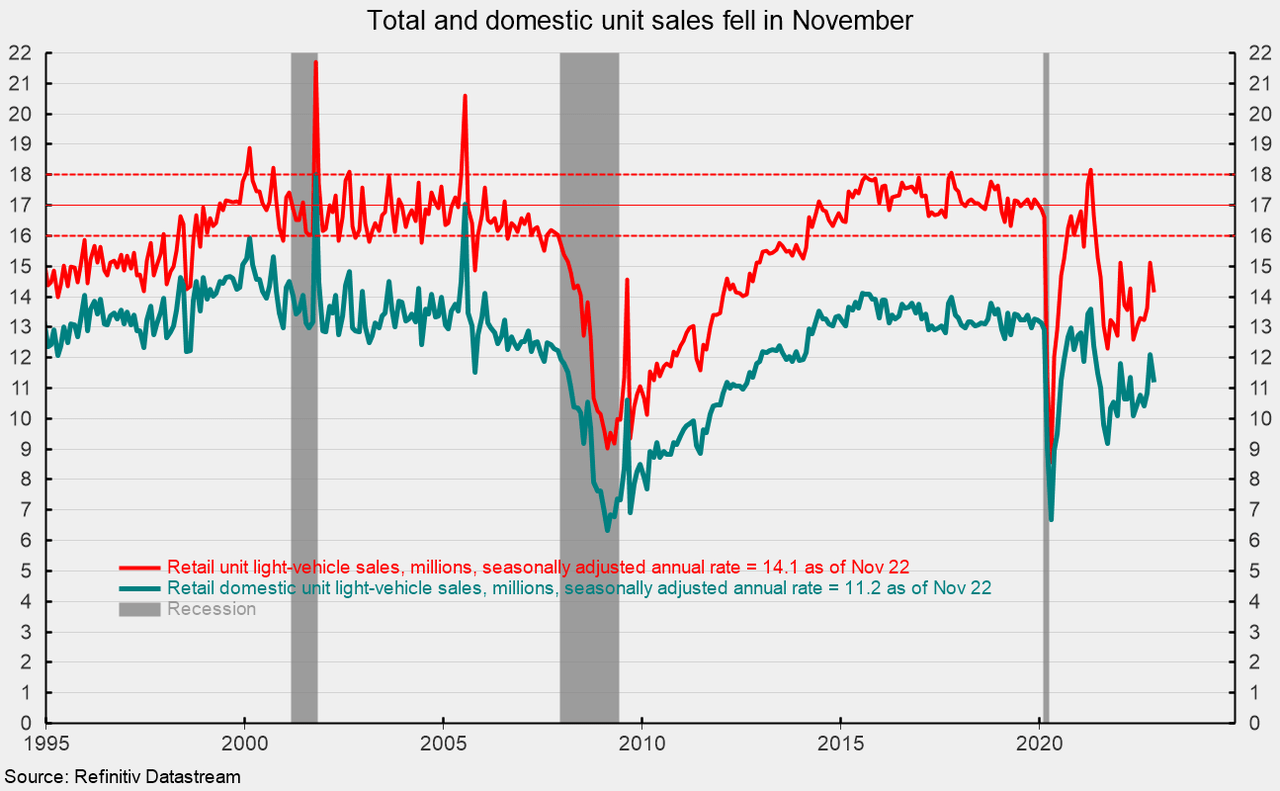
Sales of light vehicles totaled 14.1 million at an annual rate in November, down from a 15.1 million pace in October. The November result was a 6.5 percent decrease from the prior. It was the eighteenth consecutive month below the 16 to 18 million range, averaging just 13.67 million over that period (see first chart). Weak auto sales had been largely a result of component shortages that limited production, resulting in plunging inventory and surging prices. More recently, weak consumer confidence, elevated inflation, and rising interest rates are likely contributing to softer demand.
Breaking down sales by the origin of assembly, sales of domestic vehicles decreased to 11.9 million units versus 12.11 million in October, a drop of 7.5 percent, while imports fell to a 2.95 million rate from 3.02 in October, a decline of 2.1 percent. Domestic sales had generally been in the 13 million to 14 million range in the period before the pandemic, averaging 13.3 million for the six years through December 2019. The domestic share came in at 79.1 percent in November versus 80.1 in October.
Within the domestic light-vehicles category, domestic car sales were 2.32 million in November versus 2.45 million in October, a drop of 5.4 percent. Domestic light truck sales were 8.88 million versus 9.66 million in the prior month, a fall of 8.1 percent. That puts the domestic light truck share of total domestic auto sales at 79.3 percent, down from 79.8 percent in the prior month.
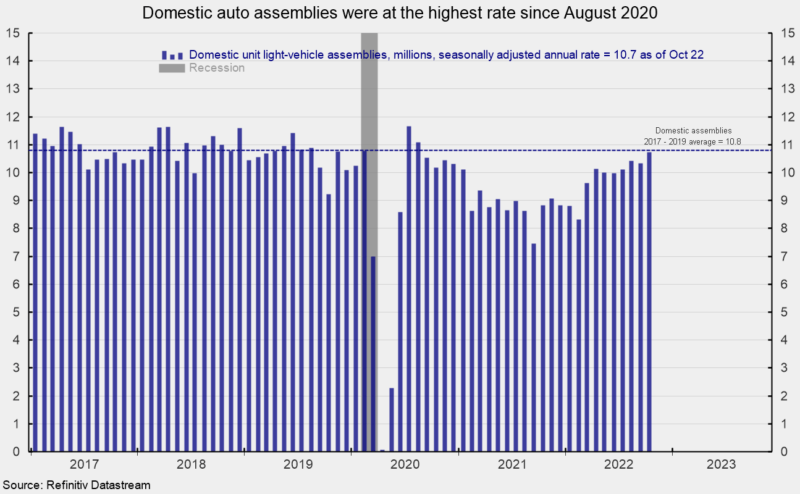
Domestic assemblies increased in October, coming in at 10.73 million at a seasonally adjusted annual rate. That is up 3.8 percent from 10.34 million in September but still below the 10.8 million average pace for the three years through December 2019 (see second chart).
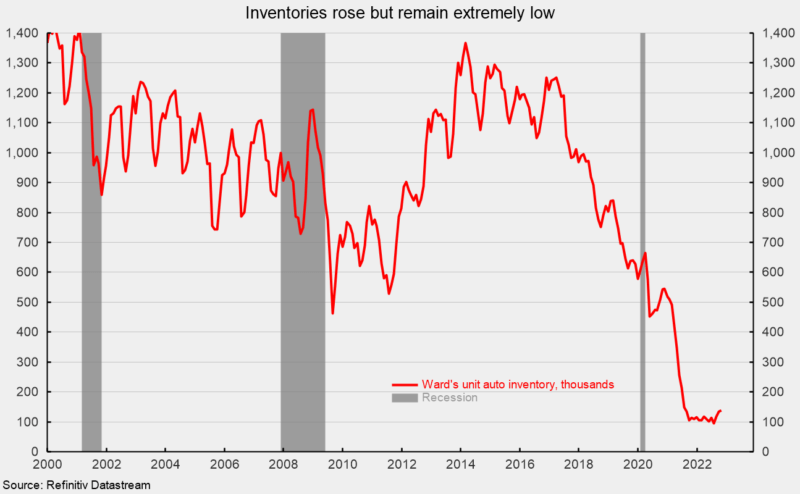
Ward’s estimate of unit auto inventory came in at 138,800 in October, up from 134,600 in September. October is at the highest level since July 2021 (see third chart). The Bureau of Economic Analysis estimates that the inventory-to-sales ratio fell to 0.521 in October, from 0.643 in September.
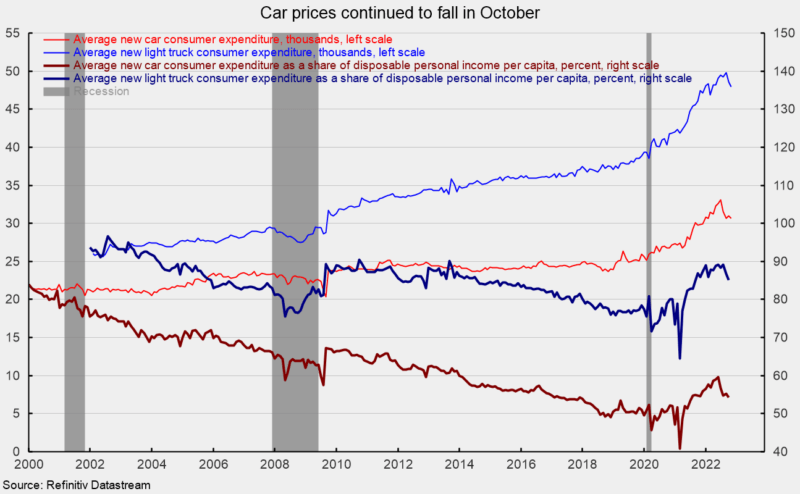
The average consumer expenditure for a car fell to $30,659 in October, down 0.9 percent from September (see fourth chart). However, the average consumer expenditure on a light truck fell to $47,983 from $48,578 in September, off 1.2 percent for the month (see fourth chart).
As a share of disposable personal income per capita, average consumer expenditures on a car came fell to 54.33 percent versus 55.22 in September, while the average consumer expenditure on a light truck as a share of disposable personal income per capita was 85.03 percent versus 86.66 percent in September (see fourth chart).
Editor’s Note: The summary bullets for this article were chosen by Seeking Alpha editors.
Be the first to comment