

Joe Raedle/Getty Images News
This article was co-produced with Dividend Sensei.
This year has been an extreme example that stocks don’t always go up.
It’s the 2nd worst start to the year in US market history, with the S&P 500 down 21%, the Nasdaq down 29%.
The worst bond bear market in history, by a wide margin, means the 60/40 retirement portfolio is down 18%.
And according to Lipper Financial, 11% of US stocks are down 80+%.
What does this mean for short-term paper wealth?
$10 trillion in US market cap gone vs. $8.5 trillion in the entire Great Recession, the 2nd worst market crash in history.
But in such times of market terror come the greatest opportunities for blue-chip dividend growth investors to earn potentially life-changing returns.
“Fortunes are made in bear markets.” – Todd Sullivan
Right now many investors are worried about a recession in 2023. In fact, JPMorgan reports that based on stock returns, the market is pricing in an 85% probability of a recession next year.
But guess what? The recession that 75% of Fortune 500 CEOs expect by the end of next year is NOT likely to be a soul-crushing collapse like the Pandemic or Great Recession.
Deutsche Bank, the first blue-chip economist team to forecast a recession in 2023, has updated its model and now expects:
-
A 3.1% GDP decline in Q3 2023.
-
A 0.4% decline in Q4 2023.
-
Growth to resume by Q1 2024.
-
A full year 2023 decline of 0.5%.
What does that mean? That Deutsche Bank now expects the 2nd mildest recession in US history behind the 0.4% decline in 2021.
Today, I want to highlight why Stanley Black & Decker (NYSE:SWK) is too cheap to ignore and potentially set to soar.
Why?
FAST Graphs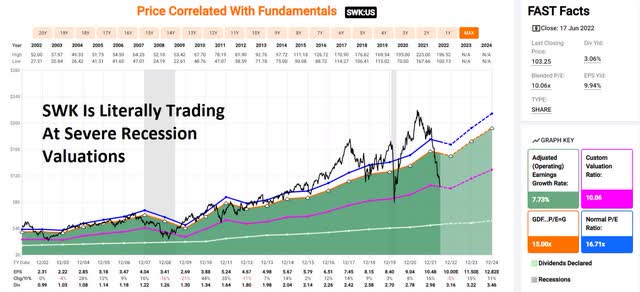
Because despite the fact that no blue-chip economist expects a severe recession next year or in 2024, SWK is already trading at valuations that we only see in severe recessionary bear market lows.
Here’s the biggest secret on Wall Street. Stocks never bottom because bad news stops coming. They bottom when the bad news is fully priced in, and historically speaking, that time is now for SWK.
-
Down 50% from its highs
-
Literally the most undervalued dividend aristocrat on Wall Street
So, let me show you why SWK is one of the best Buffett-style “fat pitches” long-term income growth investors can start swinging at today.
In fact, if analysts are right, SWK could deliver a 55% total return within a year and 3X in the next five years.
Or to put it another way, there are four reasons SWK is one of the lowest-risk ways to earn Buffett-like returns from a blue-chip bargain hiding in plain sight.
Reason One: Stanley Black & Decker Is The Complete Package
Here’s the bottom line on SWK.
Reasons To Potentially Buy SWK Today
-
86% quality low-risk 12/13 Super SWAN dividend king
-
89% dividend safety score
-
54-year dividend growth streak
-
3.1% very safe yield
-
0.5% average recession dividend cut risk
-
1.6% severe recession dividend cut risk
-
44% conservatively undervalued (potential Ultra Value strong buy)
-
Fair Value: $183.73 (17.2X earnings)
-
9.7X forward earnings vs 16.5X to 18.5X historical
-
10.1X cash-adjusted earnings
-
A stable outlook credit rating = 0.66% 30-year bankruptcy risk
-
71st industry percentile risk management consensus = Good
-
4% to 14% CAGR margin-of-error growth consensus range
-
13.1% CAGR median growth consensus
-
10% to 12% management growth guidance
-
5-year consensus total return potential: 19% to 24% CAGR
-
Base-case 5-year consensus return potential: 22% CAGR (3X S&P consensus)
-
Consensus 12-month total return forecast: 55% (12.7 PE)
-
Fundamentally Justified 12-Month Returns: 82% CAGR
SWK has suffered some recent setbacks with earnings and its latest acquisition.
-
Profitability has taken a hit
SWK is now pricing in a severe recession.
-
No economist expects a severe recession next year, just a mild one.
However, post earnings in four different investor presentations and conferences, management has reiterated its long-term growth guidance of 10% to 12% EPS growth.
“During the quarter, we also initiated $2.3 billion in share repurchases through an accelerated share repurchase as well as open market buyback activity. These actions represent significant progress towards achieving our goal of returning $4 billion in capital to our shareholders through repurchases which we expect to complete in ’23.
Taking into account the approximately $0.5 billion in dividends we expect to pay in 2022, we will have returned $2.8 billion to shareholders by the end of the year, a record for Stanley Black & Decker.” – CEO, Q1 conference call
SWK, after selling its security business for $3.2 billion recently, is buying back stock at the best valuation since the pandemic.
Management is confident that it can have its supply chain issues resolved by the end of Q2, which should boost profitability.
SWK Long-Term Growth Outlook Is Intact
|
Metric |
2021 Growth |
2022 Growth Consensus |
2023 Growth Consensus |
2024 Growth Consensus |
2025 Growth Consensus |
2026 Growth Consensus |
|
Sales |
18% |
22% |
4% |
4% |
5% |
4% |
|
Dividend |
1% |
13% (Official) |
2% |
7% |
1% |
1%/ (59-Year Streak) |
|
EPS |
16% |
-5% |
15% |
11% |
0% |
16% |
|
Operating Cash Flow |
-68% |
172% |
37% |
1% |
-10% |
7% |
|
Free Cash Flow |
-92% |
780% |
50% |
3% |
NA |
NA |
|
EBITDA |
8% |
-5% |
11% |
7% |
NA |
NA |
|
EBIT (operating income) |
11% |
2% |
13% |
7% |
NA |
NA |
(Source: FAST Graphs, FactSet)
SWK’s growth is expected to be a bit lumpy in the coming years, but it’s still expected to post overall solid growth.
Rolling Returns Since July 1985
Portfolio Visualizer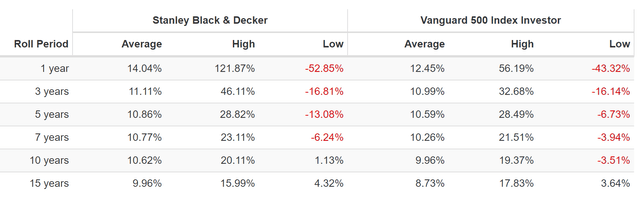
SWK is a consistently modest market beater over the last 37 years, but from bear market lows, it’s capable of returns as strong as 16% for the next 15 years and 20% for the next 10 years.
-
9.3X return in 15 years
-
6.2X return in 10 years
SWK 2024 Consensus Total Return Potential
FAST Graphs FAST Graphs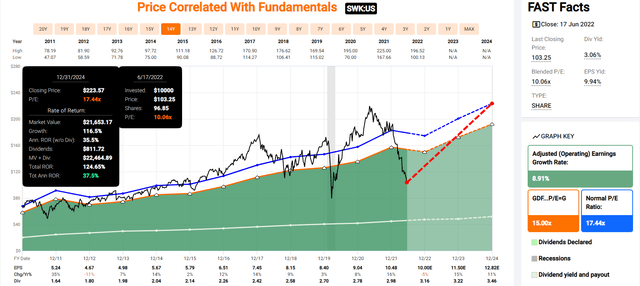
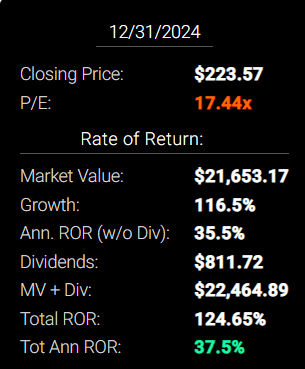
If SWK grows as analysts expect by 2024 and returns to historical mid-range fair value, it could deliver 125% total returns or 38% annually.
-
Buffett-like returns from the best aristocrat bargain hiding in plain sight.
SWK 2027 Consensus Total Return Potential
FAST Graphs Fast Graphs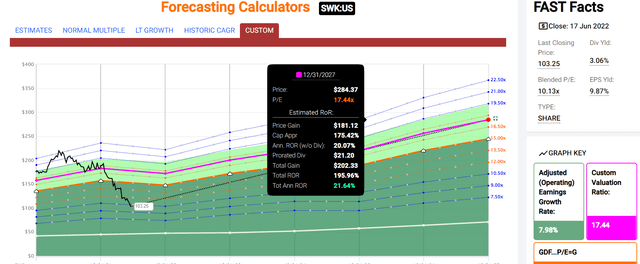
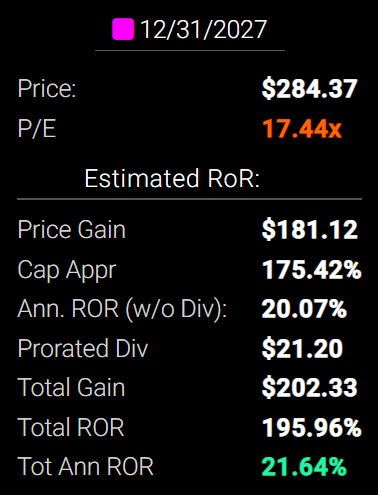
By 2027, if SWK grows as expected and returns to historical mid-range fair value, it could deliver 196% total returns or 22% annually.
-
About 3X the S&P 500 consensus
-
Buffett-like return potential
SWK Long-Term Consensus Total Return Potential
|
Investment Strategy |
Yield |
LT Consensus Growth |
LT Consensus Total Return Potential |
Long-Term Risk-Adjusted Expected Return |
Long-Term Inflation And Risk-Adjusted Expected Returns |
Years To Double Your Inflation & Risk-Adjusted Wealth |
10-Year Inflation And Risk-Adjusted Expected Return |
|
Stanley Black & Decker (Management Mid-Range Guidance) |
3.1% |
11.00% |
14.1% |
9.9% |
7.4% |
9.7 |
2.04 |
|
Dividend Growth |
2.0% |
11.5% |
13.5% |
9.5% |
7.0% |
10.3 |
1.96 |
|
Dividend Aristocrats |
2.4% |
8.5% |
10.9% |
7.6% |
5.2% |
14.0 |
1.65 |
|
S&P 500 |
1.8% |
8.5% |
10.3% |
7.2% |
4.7% |
15.2 |
1.59 |
(Sources: Morningstar, FactSet, Ycharts)
Management and analysts expect SWK to significantly outperform almost every dividend growth investment strategy as well as the dividend aristocrats and S&P 500 over the long-term.
SWK Total Returns Since July 1985
SWK was beating the market over 37 years before its recent 50% bear market.
-
30X return since 1985
-
11X adjusted for inflation
-
including a 50% bear market
A Dividend Growth Blue-Chip You Can Trust
|
Portfolio |
1986 Income Per $1,000 Investment |
2021 Income Per $1,000 Investment |
Annual Income Growth |
Starting Yield |
2021 Yield On Cost |
|
Stanley Black & Decker |
$39 |
$843 |
9.18% |
3.9% |
84.3% |
(Source: Portfolio Visualizer Premium)
SWK has delivered 9% annual income growth for investors for 35 years, turning a 3.9% yield in 1986 into an 84% yield on cost.
What about the future?
|
Analyst Consensus Income Growth Forecast |
Risk-Adjusted Expected Income Growth |
Risk And Tax-Adjusted Expected Income Growth |
Risk, Inflation, And Tax Adjusted Income Growth Consensus |
|
13.5% |
9.4% |
8.0% |
5.5% |
(Source: DK Research Terminal, FactSet)
Analysts expect 14% income growth from SWK in the future, which adjusted for the risk of it not growing as expected, inflation, and taxes is about 5.5% real expected income growth.
Now compare that to what they expect from the S&P 500.
|
Time Frame |
S&P Inflation-Adjusted Dividend Growth |
S&P Inflation-Adjusted Earnings Growth |
|
1871-2021 |
1.6% |
2.1% |
|
1945-2021 |
2.4% |
3.5% |
|
1981-2021 (Modern Falling Rate Era) |
2.8% |
3.8% |
|
2008-2021 (Modern Low Rate Era) |
3.5% |
6.2% |
|
FactSet Future Consensus |
2.0% |
5.2% |
(Sources: S&P, FactSet, Multipl.com)
What about a 60/40 retirement portfolio?
-
0.5% consensus inflation, risk, and tax-adjusted income growth.
In other words, SWK is expected to generate 2.5X faster real income growth than the S&P 500 and 11X faster income growth than a 60/40, with incredible short, medium-term, and long-term return potential.
What inflation-adjusted returns do analysts expect in the future?
Inflation-Adjusted Consensus Return Potential: $1,000 Initial Investment
|
Time Frame (Years) |
7.6% CAGR Inflation-Adjusted S&P Consensus |
8.4% Inflation-Adjusted Aristocrats Consensus |
11.6% CAGR Inflation-Adjusted SWK Consensus |
Difference Between Inflation-Adjusted SWK Consensus Vs S&P Consensus |
|
5 |
$1,445.67 |
$1,493.29 |
$1,733.42 |
$287.75 |
|
10 |
$2,089.97 |
$2,229.92 |
$3,004.76 |
$914.78 |
|
15 |
$3,021.42 |
$3,329.92 |
$5,208.51 |
$2,187.10 |
|
20 |
$4,367.98 |
$4,972.54 |
$9,028.56 |
$4,660.58 |
|
25 |
$6,314.67 |
$7,425.45 |
$15,650.32 |
$9,335.64 |
|
30 |
$9,128.95 |
$11,088.36 |
$27,128.62 |
$17,999.67 |
(Source: DK Research Terminal, FactSet)
Management and analysts believe that SWK could potentially deliver 27X inflation-adjusted returns over the next 30 years.
|
Time Frame (Years) |
Ratio Aristocrats/S&P Consensus |
Ratio Inflation-Adjusted SWK Consensus vs S&P consensus |
|
5 |
1.03 |
1.20 |
|
10 |
1.07 |
1.44 |
|
15 |
1.10 |
1.72 |
|
20 |
1.14 |
2.07 |
|
25 |
1.18 |
2.48 |
|
30 |
1.21 |
2.97 |
(Source: DK Research Terminal, FactSet)
Which is potentially 3X more than the S&P 500 and 2.5X more than the dividend aristocrats
SWK Investment Decision Score
Dividend Kings Dividend Kings
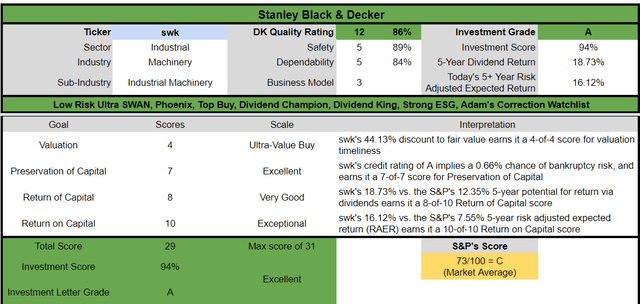
For anyone comfortable with its risk profile, SWK is one of the most reasonable and prudent dividend aristocrats you can buy today.
-
44% discount vs. 6% market discount = 38% better valuation
-
3.1% yield vs. 1.8% yield (and a much safer yield at that)
-
Potentially 40% higher long-term return potential than S&P 500 over time
-
About 2X better risk-adjusted expected return over the next five years
-
50% more consensus dividend income over the next five years
Reason Two: One Of The World’s Safest Dividend Stocks
There are many ways to measure safety and quality and I factor in pretty much all of them.
The Dividend Kings’ overall quality scores are based on a 253-point model that includes:
-
Dividend safety
-
Balance sheet strength
-
Credit ratings
-
Credit default swap medium-term bankruptcy risk data
-
Short and long-term bankruptcy risk
-
Accounting and corporate fraud risk
-
Profitability and business model
-
Growth consensus estimates
-
Management growth guidance
-
Historical earnings growth rates
-
Historical cash flow growth rates
-
Historical dividend growth rates
-
Historical sales growth rates
-
Cost of capital
-
GF Scores
-
Long-term risk-management scores from MSCI, Morningstar, FactSet, S&P, Reuters/Refinitiv, and Just Capital
-
Management quality
-
Dividend-friendly corporate culture/income dependability
-
Long-term total returns (a Ben Graham sign of quality)
-
Analyst consensus long-term return potential
In fact, it includes over 1,000 fundamental metrics including the 12 rating agencies we use to assess fundamental risk.
-
credit and risk management ratings make up 41% of the DK safety and quality model
-
dividend/balance sheet/risk ratings make up 82% of the DK safety and quality model
How do we know that our safety and quality model works well?
During the two worst recessions in 75 years, our safety model 87% of blue-chip dividend cuts, the ultimate baptism by fire for any dividend safety model.
How does SWK score on our comprehensive safety and quality models?
SWK Dividend Safety
|
Rating |
Dividend Kings Safety Score (162 Point Safety Model) |
Approximate Dividend Cut Risk (Average Recession) |
Approximate Dividend Cut Risk In Pandemic Level Recession |
|
1 – unsafe |
0% to 20% |
over 4% |
16+% |
|
2- below average |
21% to 40% |
over 2% |
8% to 16% |
|
3 – average |
41% to 60% |
2% |
4% to 8% |
|
4 – safe |
61% to 80% |
1% |
2% to 4% |
|
5- very safe |
81% to 100% |
0.5% |
1% to 2% |
|
SWK |
89% |
0.5% |
1.6% |
|
Risk Rating |
Low-Risk (71st industry percentile risk-management consensus) |
A stable outlook credit rating 0.66% 30-year bankruptcy risk |
15% OR LESS Max Risk Cap Recommendation |
Long-Term Dependability
|
Company |
DK Long-Term Dependability Score |
Interpretation |
Points |
|
Non-Dependable Companies |
21% or below |
Poor Dependability |
1 |
|
Low Dependability Companies |
22% to 60% |
Below-Average Dependability |
2 |
|
S&P 500/Industry Average |
61% (61% to 70% range) |
Average Dependability |
3 |
|
Above-Average |
71% to 80% |
Very Dependable |
4 |
|
Very Good |
81% or higher |
Exceptional Dependability |
5 |
|
SWK |
84% |
Exceptional Dependability |
5 |
Overall Quality
|
SWK |
Final Score |
Rating |
|
Safety |
89% |
5/5 Very Safe |
|
Business Model |
70% |
2/3 Narrow and Stable Moat |
|
Dependability |
84% |
5/5 Exceptional |
|
Total |
86% |
12/13 Super SWAN Dividend King |
|
Risk Rating |
3/3 Low-Risk |
|
|
15% OR LESS Max Risk Cap Rec |
10% Margin of Safety For A Potentially Good Buy |
-
SWK has experienced deterioration in its profitability, advanced accounting metrics, and a small decrease in long-term risk-management ratings.
-
Downgraded to 12/13 Super SWAN from 13/13 Ultra SWAN
-
Quality fell from 92% to 86%
-
Still one of the highest quality companies on earth
How high quality is SWK?
It’s in the 77th percentile of the DK 500 Master List.
-
every dividend aristocrat
-
every dividend champion
-
every dividend king
-
every global aristocrat
-
and 40 of the world’s best growth stocks
And even among the most elite companies on earth SWK is higher quality than 77% of them.
Why I Trust Stanley Black & Decker And So Can You
-
Stanley Black & Decker Is The Ultimate Buy And Hold Forever Dividend Aristocrat Bargain
-
An in-depth look at SWK’s brands and plans to accelerate its long-term growth, including through harnessing secular megatrends such as the housing boom (expected to last 20 years according to Morgan Stanley)
SWK was founded in 1843 in New Britain, Connecticut.
SWK hasn’t missed a dividend payment in 146 years (since 1876) through:
-
23 recessions
-
Six depressions
-
Interest rates ranging from 0% to 20%
-
Treasury yields ranging from 0.3% to 16%
-
Inflation ranging from -2.5% to 20%
SWK has been raising its dividend for 54 consecutive years (since 1968) including through:
-
Eight recessions
-
The Pandemic
-
Two energy crises
-
The Great Recession
-
The stagflation of the 1970s
SWK is built to last and will likely outlive us all.
SWK has the most trusted brands with the #1 market share globally.
Management returns 50% of free cash flow to shareholders via buybacks and dividends and uses the other half for M&A.
That’s how it plans to deliver about 11% long-term growth and 14.1% long-term annual total returns.
-
about 3% more than the dividend aristocrats and 4% more than the S&P 500
The average EV generates 4.5X the sales per vehicle as regular gas cars.
And electrifying outdoor tools represent a potential growth opportunity in a $25 billion global market.
SWK is targeting some of the biggest megatrends in history as part of its growth plan.
-
electrification of cars
-
infrastructure
-
secular housing boom
Quantitative Analysis: The Math Backing Up The Investment Thesis
Ben Graham recommended combining qualitative (the story) analysis with quantitative analysis looking at the past, present, and likely future.
SWK Credit Ratings
|
Rating Agency |
Credit Rating |
30-Year Default/Bankruptcy Risk |
Chance of Losing 100% Of Your Investment 1 In |
|
S&P |
A stable |
0.66% |
151.5 |
|
Fitch |
A- stable |
2.50% |
40.0 |
|
Moody’s |
Baa1 (BBB+ equivalent) negative outlook |
5.00% |
20.0 |
|
Consensus |
A- stable |
2.72% |
36.8 |
(Source: S&P, Fitch, Moody’s)
Rating agencies estimate SWK’s fundamental risk at 2.72%.
-
a 1 in 37 chance of losing all your money buying SWK today
On June 6th, Moody’s downgraded SWK to a negative outlook.
“The change in outlook to negative from stable reflects the material contraction in Stanley’s operating performance. Moody’s revised downward its forward views and now projects an EBITA margin slightly above 11% for 2023 (14.5% previously for 2023).
Stanley is facing commodity inflation, higher supply chain costs to serve demand, and lower volumes, in addition to higher personnel expenses, transportation, and energy costs than in previous years.
All these factors are weighing on the company’s operating performance. Moody’s believes that management is taking actions such as increasing pricing and investing to reduce supply chain costs, but tangible results to markedly improve operations over the next eighteen months may be difficult to achieve.
“Stanley is weakly positioned relative to similarly rated companies,” said Peter Doyle, Vice President at Moody’s. “Stanley must execute on its operating plan and exceed Moody’s expectations in order to maintain its Baa1 rating,” added Doyle.” – Moody’s
That sounds scary but it’s really not.
“Moody’s projects a significant improvement in Stanley’s liquidity profile over the next eighteen months. Proceeds from asset sales and free cash flow will be used to repay all short-term debt, which totaled $5.1 billion on April 2, 2022, resulting in no borrowings under the company’s liquidity facilities by late 2022.
Stanley has access to $4.5 billion in 364-day revolving credit facilities, which Moody’s believes can be easily renewed, and a $2.5 billion revolving credit expiring in 2026. These facilities fully backstop Stanley’s $3.5 billion combined US and European commercial paper programs, which enhances the company’s liquidity profile.
Also, Moody’s projects that Stanley will generate about $500 million of free cash flow in 2022 and increase to $1 billion by 2023. Excess cash will be used to reduce short-term borrowings and to repurchase shares under the company’s remaining authorization of $1.7 billion.” – Moody’s
SWK has ample liquidity and Moody’s expects its short-term debt will be gone by the end of the year.
“FACTORS THAT COULD LEAD TO AN UPGRADE OR DOWNGRADE OF THE RATINGS
Stabilization of Stanley’s ratings would ensue if the company executes on its operating plan, resulting in an EBITA margin above 12%, adjusted debt-to-EBITDA approaching 2.5x, and adjusted retained cash flow-to-net debt over 30%.
A downgrade could occur if Stanley fails to improve significantly its operating performance, leverage remains elevated or asset sale proceeds fail to materialize.
While unlikely given Stanley’s negative outlook, a rating upgrade would ensue if the company experiences consistently stronger profitability such that EBITA margin is above 15%, adjusted debt-to-EBITDA is below 2.0x, and adjusted retained cash flow-to-net debt is over 35%.
An upgrade would also require the preservation of robust liquidity, maintaining conservative financial policies, and a low level of financial complexity.” – Moody’s
If SWK gets its debt/EBITDA under 2, long-term Moody’s says it could upgrade it to A-, the same as S&P and Fitch.
SWK Leverage Consensus Forecast
|
Year |
Debt/EBITDA |
Net Debt/EBITDA (3.0 Or Less Safe According To Credit Rating Agencies) |
Interest Coverage (8+ Safe) |
|
2020 |
1.73 |
1.16 |
10.37 |
|
2021 |
2.56 |
2.48 |
12.53 |
|
2022 |
2.97 |
2.26 |
9.40 |
|
2023 |
2.68 |
2.07 |
10.20 |
|
2024 |
2.35 |
1.73 |
9.71 |
|
2025 |
NA |
NA |
12.37 |
|
2026 |
NA |
NA |
16.98 |
|
Annualized Change |
8.02% |
10.35% |
-1.64% |
(Source: FactSet Research Terminal)
SWK took on a lot of debt during the pandemic to maximize its cash position, as many companies did.
Its debt levels always remained safe, however, and its leverage is expected to decrease over time.
Rating agencies aren’t significantly worried about SWK’s debt, or big buyback plans, or a potential recession
SWK Balance Sheet Consensus Forecast
|
Year |
Total Debt (Millions) |
Cash |
Net Debt (Millions) |
Interest Cost (Millions) |
EBITDA (Millions) |
Operating Income (Millions) |
|
2020 |
$4,247 |
$1,381 |
$2,866 |
$205 |
$2,461 |
$2,126 |
|
2021 |
$6,661 |
$142 |
$6,454 |
$176 |
$2,603 |
$2,205 |
|
2022 |
$7,788 |
$2,212 |
$5,943 |
$242 |
$2,625 |
$2,275 |
|
2023 |
$7,848 |
$2,130 |
$6,064 |
$241 |
$2,933 |
$2,459 |
|
2024 |
$7,348 |
$2,192 |
$5,400 |
$271 |
$3,127 |
$2,631 |
|
2025 |
NA |
NA |
NA |
$238 |
$3,436 |
$2,945 |
|
2026 |
NA |
NA |
NA |
$187 |
$3,676 |
$3,176 |
|
Annualized Growth |
14.69% |
12.24% |
17.16% |
-1.52% |
6.92% |
6.92% |
(Source: FactSet Research Terminal)
SWK’s debt is expected to remain stable over the next few years while cash flow servicing its debt grows at 7% annually.
SWK Bond Profile
-
$3.1 billion in liquidity
-
Well-staggered debt maturities (little problem refinancing maturing bonds)
-
No debt maturing until 2025
-
86% unsecured bonds (good financial flexibility)
-
Bond investors are so confident in SWK’s long-term plans they were willing to buy its 40-year bonds at 4% interest rates
-
Now yields 6.6% because even 10-year AAA-rated bonds are over 4%
-
2.55% average borrowing cost
-
0.1% inflation-adjusted borrowing costs vs 8% returns on capital
SWK Credit Default Swaps: Real-Time Fundamental Risk Analysis From The Bond Market
FactSet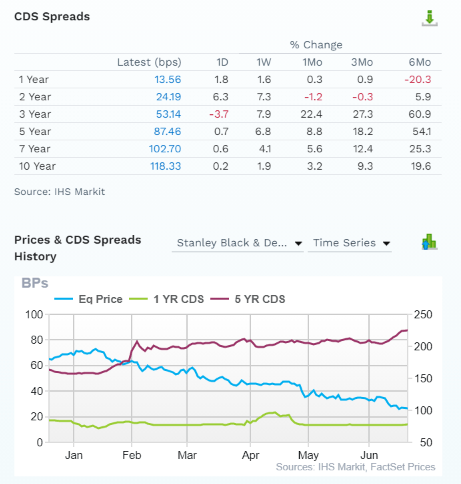
Credit default Swaps are the insurance policies bond investors take out against default. They represent real-time fundamental risk assessment from the “smart money” on Wall Street.
SWK’s fundamental risk is up a bit over the last six months but doesn’t justify the major stock price crash. The bond market is pricing in a 3.54% 30-year default risk, which is consistent with its credit ratings. Analysts, rating agencies, and the bond market all agree SWK’s thesis is intact. 20 analysts, 8 rating agencies, and the bond market make up our SWK expert consensus.
28 expert consensus + the bond market monitoring SWK’s risk profile is how we track fundamental risk in real-time to ensure high-probability/low-risk investment recommendations.
SWK GF Score: The Newest Addition To The DK Safety And Quality Model
The GF Score is a ranking system that has been found to be closely correlated to the long-term performances of stocks by backtesting from 2006 to 2021.” – Gurufocus
GF Score takes five key aspects into consideration. They are:
-
Financial Strength
-
Profitability
-
Growth
-
Valuation
-
Momentum
SWK’s good score of 76/100 GF score confirms overall strong fundamentals despite the short-term challenges its facing.
SWK Profitability: Wall Street’s Favorite Quality Proxy
SWK’s historical profitability has fallen to the top 30% of its peers, the reason for the downgrade to narrow moat.
SWK Trailing 12-Month Profitability Vs. Peers
|
Metric |
TTM |
Industry Percentile |
Major Industrial Companies More Profitable Than SWK (Out Of 2,768) |
|
Gross Margins |
31.10% |
62.56 |
1036 |
|
Operating Margin |
9.13% |
62.54 |
1037 |
|
Net Margin |
8.68% |
68.09 |
883 |
|
Return On Equity |
12.58% |
71.72 |
783 |
|
Return On Assets |
5.31% |
60.48 |
1094 |
|
Returns On Invested Capital |
7.23% |
56.29 |
1210 |
|
Return On Capital (Greenblatt) |
37.69% |
84.25 |
436 |
|
Return On Capital Employed |
7.45% |
44.41 |
1539 |
|
Average |
14.90% |
63.79 |
1002 |
(Source: GuruFocus Premium)
In the last year, SWK’s profitability has dropped to the top 36% of its peers.
Over the last 30 years, SWK’s profitability has been relatively stable adjusting for the natural cyclicality of its industry.
SWK Profit Margin Consensus Forecast
|
Year |
FCF Margin |
EBITDA Margin |
EBIT (Operating) Margin |
Net Margin |
Return On Capital Expansion |
Return On Capital Forecast |
|
2020 |
11.5% |
16.9% |
14.6% |
9.7% |
1.00 |
|
|
2021 |
0.9% |
16.7% |
14.1% |
11.1% |
TTM ROC |
37.69% |
|
2022 |
6.9% |
13.8% |
12.0% |
8.3% |
Latest ROC |
18.20% |
|
2023 |
9.9% |
14.8% |
12.4% |
8.9% |
2026 ROC |
37.86% |
|
2024 |
9.2% |
15.2% |
12.8% |
9.6% |
2026 ROC |
18.28% |
|
2025 |
8.0% |
15.9% |
13.7% |
9.6% |
Average |
28.07% |
|
2026 |
8.7% |
16.4% |
14.2% |
10.4% |
Industry Median |
13.25% |
|
2027 |
NA |
NA |
NA |
NA |
SWK/Industry Median |
2.12 |
|
Annualized Growth |
-4.54% |
-0.50% |
-0.50% |
1.16% |
Vs S&P |
1.92 |
|
Annualized Growth (Post Pandemic) |
56.67% |
-0.31% |
0.09% |
-1.28% |
(Source: FactSet Research Terminal)
SWK’s strong profitability is expected to remain stable over time with high single-digit free cash flow margins and returns on capital 2X that of its industry peers and S&P 500.
Return on capital is annual pre-tax profit/operating capital (the money it takes to run the business). ROC is Greenblatt’s gold standard proxy for quality and moatiness.
S&P 500 ROC is 14.6%. For each $1 it takes to run the average S&P company, they generate $0.146 in annual pre-tax profit. It takes about 6.5 years for new investments to pay for themselves.
For SWK, ROC was 37% in the last year and is expected to remain relatively stable over the coming years. For every $1 it takes to run SWK, it is expected to generate $0.28 in annual pre-tax profit. Investments take about 4 years to pay for themselves.
By the definition of one of the greatest investors in history, SWK is about 2X higher quality than its peers and 2X higher quality than the S&P 500.
Over the last 30 years, SWK’s ROC has been trending higher at 2.2% annually, confirming its narrow but stable moat.
Reason Three: A Strong Growth Profile For Decades To Come
According to the Graham/Dodd fair value formula, SWK is currently priced for about 0.75% long-term growth. Here’s what analysts actually expect.
SWK Medium-Term Growth Consensus Forecast
|
Year |
Sales |
Free Cash Flow |
EBITDA |
EBIT (Operating Income) |
Net Income |
|
2020 |
$14,535 |
$1,674 |
$2,461 |
$2,126 |
$1,410 |
|
2021 |
$15,600 |
$144 |
$2,603 |
$2,205 |
$1,729 |
|
2022 |
$19,004 |
$1,307 |
$2,625 |
$2,275 |
$1,572 |
|
2023 |
$19,808 |
$1,960 |
$2,933 |
$2,459 |
$1,769 |
|
2024 |
$20,578 |
$1,897 |
$3,127 |
$2,631 |
$1,983 |
|
2025 |
$21,543 |
$1,731 |
$3,436 |
$2,945 |
$2,077 |
|
2026 |
$22,370 |
$1,949 |
$3,676 |
$3,176 |
$2,325 |
|
Annualized Growth |
7.45% |
2.57% |
6.92% |
6.92% |
8.69% |
|
Annualized Growth (Post Pandemic) |
7.48% |
68.38% |
7.15% |
7.57% |
6.10% |
|
Cumulative Over The Next 4 Years |
$103,303 |
$8,844 |
$15,797 |
$13,486 |
$9,726 |
(Source: FactSet Research Terminal)
SWK is expected to grow steadily over time and convert 91% of its net income into free cash flow.
-
very good for an industrial
-
FCF is what pays the dividend
SWK Dividend Growth Consensus Forecast
|
Year |
Dividend Consensus |
FCF Consensus |
FCF Payout Ratio |
Retained (Post-Dividend) Free Cash Flow |
Buyback Potential |
Debt Repayment Potential |
|
2022 |
$3.16 |
$9.55 |
33.1% |
$965 |
6.23% |
12.4% |
|
2023 |
$3.22 |
$14.62 |
22.0% |
$1,721 |
11.11% |
21.9% |
|
2024 |
$3.46 |
$13.38 |
25.9% |
$1,498 |
9.67% |
19.1% |
|
Total 2022 Through 2024 |
$9.84 |
$37.55 |
26.2% |
$4,184.21 |
27.00% |
53.32% |
|
Annualized Rate |
4.64% |
18.37% |
-11.60% |
24.60% |
24.60% |
24.12% |
(Source: FactSet Research Terminal)
Credit rating agencies consider 60% a safe payout ratio for industrials.
SWK has a 33% payout ratio that’s expected to average 26% over the next three years, less than half the safety guideline.
$4.1 billion in post-dividend retained free cash flow is enough to potentially repay 53% of its debt or buy back up to 27% of shares at current valuations.
The longer SWK languishes in a bear market the more shares they buy back at steadily more accretive levels, reducing the dividend cost and reducing the payout ratio even more. SWK’s long-term growth actually benefits from a lower share price.
SWK Buyback Consensus Forecast
|
Year |
Consensus Buybacks ($ Millions) |
% Of Shares (At Current Valuations) |
Market Cap |
|
2022 |
$1,158.0 |
7.5% |
$15,497 |
|
2023 |
$827.0 |
5.3% |
$15,497 |
|
2024 |
$429.0 |
2.8% |
$15,497 |
|
Total 2022-2024 |
$2,414.00 |
15.6% |
$15,497 |
|
Annualized Rate |
5.42% |
Average Annual Buybacks |
$804.67 |
(Source: FactSet Research Terminal)
SWK is expected to spend $2.4 billion on buybacks over the next three years, which could repurchase almost 16% of shares at current valuations.
SWK uses its shares to make opportunistic acquisitions and then opportunistically buys back stock when shares are undervalued.
The share count is down 7.6% in the last 12 months, a very reasonable and prudent time to be buying back shares by the truckload.
|
Time Frame (Years) |
Net Buyback Rate |
Shares Remaining |
Net Shares Repurchased |
Each Share You Own Is Worth X Times More (Not Including Future Growth And Dividends) |
|
5 |
5.4% |
75.68% |
24.32% |
1.32 |
|
10 |
5.4% |
57.28% |
42.72% |
1.75 |
|
15 |
5.4% |
43.35% |
56.65% |
2.31 |
|
20 |
5.4% |
32.81% |
67.19% |
3.05 |
|
25 |
5.4% |
24.83% |
75.17% |
4.03 |
|
30 |
5.4% |
18.79% |
81.21% |
5.32 |
(Source: DK Research Terminal, Ycharts)
If SWK buys back stock at the rate analysts currently expect for five years, that would potentially cut the share count by 24% and increase the intrinsic value of all existing shares by 32%.
-
not counting future growth
SWK Long-Term Growth Outlook
-
5% to 13.1% growth consensus range (five sources)
-
the Reuters consensus is for 13.1% growth, faster than the last five years
-
management guidance 10% to 12%
How accurate are analyst forecasts for SWK?
-
Smoothing for outliers, historical analyst margins-of-error are 15% to the downside and 5% to the upside.
-
margin-of-error adjusted growth guidance range: 4% to 14% CAGR (including management guidance).
-
70% statistical probability that SWK grows 4% to 14% over time.
Over the last 20 years, SWK has grown at between 7% and 16% CAGR.
Analysts and management expect future growth to be similar to the last 12 years.
Reason Four: One Of The World’s Best Dividend Stocks Is Crazy, Stupid, Cheap
For 20 years, outside of bear markets and bubbles millions of income growth investors have consistently paid between 16.5 and 18.5X earnings for SWK.
-
91% statistical probability that this approximates intrinsic value
|
Metric |
Historical Fair Value Multiples (14-Years) |
2021 |
2022 |
2023 |
2024 |
2025 |
12-Month Forward Fair Value |
|
5-Year Average Yield |
1.75% |
$170.29 |
$180.57 |
$180.57 |
$201.71 |
NA |
|
|
Earnings |
17.44 |
$195.33 |
$171.96 |
$200.04 |
$252.36 |
$292.99 |
|
|
Average |
$181.95 |
$176.16 |
$189.81 |
$224.21 |
$292.99 |
$182.72 |
|
|
Current Price |
$102.65 |
||||||
|
Discount To Fair Value |
43.58% |
41.73% |
45.92% |
54.22% |
64.96% |
43.82% |
|
|
Upside To Fair Value (NOT Including Dividends) |
77.25% |
71.61% |
84.91% |
118.42% |
185.43% |
78.00% (81% including dividend) |
|
|
2022 EPS |
2023 EPS |
2021 Weighted EPS |
2022 Weighted EPS |
12-Month Forward EPS |
12-Month Average Fair Value Forward PE |
Current Forward PE |
|
|
$9.86 |
$11.47 |
$5.12 |
$5.51 |
$10.63 |
17.2 |
9.7 |
I estimate SWK is worth 17.2X earnings and today it trades at 9.7X, literally levels not seen outside of severe recessionary bear market lows.
-
10.2X cash-adjusted earnings
-
a bargain by private equity standards
|
Analyst Median 12-Month Price Target |
Morningstar Fair Value Estimate |
|
$156.12 (12.7X earnings) |
$159.75 (Quant model, 15.0X earnings) |
|
Discount To Price Target (Not A Fair Value Estimate) |
Discount To Fair Value |
|
34.25% |
35.74% |
|
Upside To Price Target (Not Including Dividend) |
Upside To Fair Value (Not Including Dividend) |
|
52.09% |
55.63% |
|
12-Month Median Total Return Price (Including Dividend) |
Fair Value + 12-Month Dividend |
|
$159.28 |
$162.91 |
|
Discount To Total Price Target (Not A Fair Value Estimate) |
Discount To Fair Value + 12-Month Dividend |
|
35.55% |
36.99% |
|
Upside To Price Target ( Including Dividend) |
Upside To Fair Value + Dividend |
|
55.17% |
58.70% |
Morningstar doesn’t have an analyst covering SWK so its quant fair value estimate is based on comparing it to its peers, which is never as statistically accurate as compared to a company’s own historical market-determined fair value. Right now, industrial stocks are in a bear market, reducing Morningstar’s fair value estimate. Morningstar’s quant model still says SWK is 36% undervalued.
Analysts expect SWK to trade at 12.7X earnings in 12 months, delivering a 55% consensus total return in just a year.
81% upside would be justified by SWK’s fundamentals.
I don’t make recommendations based on 12-month price targets but on whether a company’s margin of safety is sufficient to compensate for its risk profile.
|
Rating |
Margin Of Safety For Low-Risk 12/13 Super SWAN quality companies |
2022 Price |
2023 Price |
12-Month Forward Fair Value |
|
Potentially Reasonable Buy |
0% |
$176.16 |
$189.81 |
$182.72 |
|
Potentially Good Buy |
10% |
$158.54 |
$170.83 |
$164.45 |
|
Potentially Strong Buy |
20% |
$140.93 |
$151.85 |
$146.18 |
|
Potentially Very Strong Buy |
30% |
$110.98 |
$132.86 |
$127.90 |
|
Potentially Ultra-Value Buy |
40% |
$105.70 |
$113.88 |
$109.63 |
|
Currently |
$102.65 |
41.73% |
45.92% |
43.82% |
|
Upside To Fair Value (Not Including Dividends) |
71.61% |
84.91% |
78.00% |
For anyone comfortable with its risk profile, SWK is a potential Ultra Value strong buy.
Risk Profile: Why Stanley Black & Decker Isn’t Right For Everyone
These are my personal rule of thumb for when to sell a stock if the investment thesis has broken. SWK is highly unlikely to suffer such catastrophic declines in fundamentals.
What Could Cause SWK’s Investment Thesis To Break
-
Safety falls to 40% or less
-
Balance sheet collapses (highly unlikely, 0.66% to 5% probability according to rating agencies)
-
Growth outlook falls to less than 6.9% for six years
-
SWK’s role in my portfolio is to deliver long-term 8+% returns with minimal fundamental risk
-
8+% total return requirement for defensive sectors
-
10+% for non-defensive (cyclical) sectors – like industrials
How long it takes for a company’s investment thesis to break depends on the quality of the company.
|
Quality |
Years For The Thesis To Break Entirely |
|
Below-Average |
1 |
|
Average |
2 |
|
Above-Average |
3 |
|
Blue-Chip |
4 |
|
SWAN |
5 |
|
Super SWAN |
6 |
|
Ultra SWAN |
7 |
|
100% Quality Companies (MSFT, LOW, and MA) |
8 |
There are no risk-free companies and no company is right for everyone. You have to be comfortable with the fundamental risk profile.
SWK’s Risk Profile Summary
-
Economic cyclicality risk: sales could suffer in a recession
-
M&A risk: SWK frequently makes tuck-in acquisitions
-
Margin compression risk: over 2,700 major global rivals
-
Supply chain disruption risk: big impact in 2021 (SK is a major supplier, NK war risk)
-
Technology disruption risk
-
Customer concentration risk: top 2 customers (HD and LOW): 29% of sales
-
Labor retention risk (tightest job market in over 50 years) – rising wage pressures
-
Currency risk (growing over time due to international expansion)
-
Pension fund risk: $2.6 billion pension fund
-
Recall/legal liability risk
-
Accounting fraud risk: less than 17.5% statistical chance of accounting fraud
“The continued creation, development, and advancement of new technologies such as 5G data networks, artificial intelligence, blockchain, quantum computing, data analytics, 3-D printing, robotics, sensor technology, data storage, neural networks, augmented reality, amongst others, as well as other technologies in the future that are not foreseen today, continue to transform the Company’s processes, products, and services.” – 10-K
SWK’s risk profile stretches 14 pages in its annual report, which isn’t unusual for this industry.
How do we quantify, monitor, and track such a complex risk profile? By doing what big institutions do.
Long-Term Risk Analysis: How Large Institutions Measure Total Risk
See the risk section of this video to get an in-depth view (and link to two reports) of how DK and big institutions measure long-term risk management by companies.
SWK Long-Term Risk-Management Consensus
|
Rating Agency |
Industry Percentile |
Rating Agency Classification |
|
MSCI 37 Metric Model |
42.0% |
BBB Average, Stable Trend |
|
Morningstar/Sustainalytics 20 Metric Model |
82.4% |
25.7/100 Medium-Risk |
|
Reuters/Refinitiv 500+ Metric Model |
88.0% |
Average |
|
S&P 1,000+ Metric Model |
81.0% |
Very Good, Stable Trend |
|
Just Capital 19 Metric Model |
91.3% |
Exceptional |
|
FactSet |
50.0% |
Average, Positive Trend |
|
Morningstar Global Percentile (All 15,000 Rated Companies) |
54.1% |
Average |
|
Just Capital Global Percentile (All 954 Rated US Companies) |
81.8% |
Very Good |
|
Consensus |
71% |
Low-Risk, Good Risk-Management, Stable Trend |
(Sources: MSCI, Morningstar, FactSet, S&P, Just Capital, Reuters)
SWK’s Long-Term Risk Management Is The 174th Best In The Master List (65th Percentile)
|
Classification |
Average Consensus LT Risk-Management Industry Percentile |
Risk-Management Rating |
|
S&P Global (SPGI) #1 Risk Management In The Master List |
94 |
Exceptional |
|
Strong ESG Stocks |
78 |
Good – Bordering On Very Good |
|
Foreign Dividend Stocks |
75 |
Good |
|
Stanley Black & Decker |
71 |
Good |
|
Ultra SWANs |
71 |
Good |
|
Low Volatility Stocks |
68 |
Above-Average |
|
Dividend Aristocrats |
67 |
Above-Average |
|
Dividend Kings |
63 |
Above-Average |
|
Master List average |
62 |
Above-Average |
|
Hyper-Growth stocks |
61 |
Above-Average |
|
Monthly Dividend Stocks |
60 |
Above-Average |
|
Dividend Champions |
57 |
Average |
(Source: DK Research Terminal)
SWK’s risk-management consensus is in the top 35% of the world’s highest quality companies and similar to that of such other blue-chips as
-
Caterpillar (CAT) – dividend aristocrat
-
British American Tobacco (BTI) – global aristocrat
-
Clorox (CLX) – dividend aristocrat
-
NextEra Energy (NEE) – dividend aristocrat
-
McCormick (MKC) – dividend aristocrat
-
Enbridge (ENB) – global aristocrat
-
Canadian National Railway (CNI) – global aristocrat
The bottom line is that all companies have risks, and SWK is good at managing theirs.
How We Monitor SWK’s Risk Profile
-
20 analysts
-
3 credit rating agencies
-
8 total risk rating agencies
-
28 experts who collectively know this business better than anyone other than management
-
the bond market provides real-time fundamental risk-assessments
“When the facts change, I change my mind. What do you do sir?” – John Maynard Keynes
There are no sacred cows at iREIT or Dividend Kings. Wherever the fundamentals lead we always follow. That’s the essence of disciplined financial science, the math behind retiring rich and staying rich in retirement.
Bottom Line: Stanley Black & Decker Is One Of The Best Dividend Aristocrat Bargains On Wall Street
Don’t get me wrong when I talk about safe dividend stocks, I am always talking about dividend safety and fundamental risk.
Safe has nothing to do with short-term price volatility.
|
Time Frame |
Historically Average Bear Market Bottom |
|
Non-Recessionary Bear Markets Since 1965 |
-21% (Achieved May 20th) |
|
Median Recessionary Bear Market Since WWII |
-24% (Citigroup base case with a mild recession) June 16th |
|
Non-Recessionary Bear Markets Since 1928 |
-26% (Goldman Sachs base case with a mild recession) |
|
Average Bear Markets Since WWII |
-30% (Morgan Stanley base case) |
|
Recessionary Bear Markets Since 1965 |
-36% (Bank of America recessionary base case) |
|
All 140 Bear Markets Since 1792 |
-37% |
|
Average Recessionary Bear Market Since 1928 |
-40% (Deutsche Bank, Bridgewater, SocGen Severe Recessionary base case, Morgan Stanley Recessionary Base Case) |
(Sources: Ben Carlson, Bank of America, Oxford Economics, Goldman Sachs)
No one knows when the market will finally price in the potential for recession next year. And even the most accurate blue-chip economist teams on earth disagree.
Some, like Citi and Goldman, think we’ve already possibly bottomed. Others, like Morgan Stanley, think the market has over 20% more to fall IF we get a recession next year (not a guarantee by any means).
If the market does roll over again, I fully expect SWK to fall a bit more.
But at some point, it will become too cheap to fall any more, and at that point the best-coiled spring aristocrat on Wall Street is expected to take off like a rocket.
How fast could SWK soar?
Analysts currently expect a 55% gain in 12 months.
Its fundamentals are so strong and its valuation so low, it could soar 81% and just return to fair value.
And if SWK delivers the growth that management and analysts expect over the next five years, then it could triple by merely returning to fair value.
Right now future market returns are their best in years, 60% by 2027 according to analysts.
But SWK? More than 3X that, a 200% consensus return potential.
And not from some fly-by-night non-profitable tech stock, but one of the world’s most dependable blue-chips.
Here is what I can say with 80% confidence.
-
SWK is one of the world’s safest, most dependable, and highest quality companies on earth
-
and one of the most undervalued aristocrats on Wall Street
-
3.1% very safe yield
-
14.1% CAGR long-term total return guidance
-
44% discount to fair value = potential Ultra Value strong buy
-
9.7X earnings
-
about 200% consensus return potential over the next five years, 22% CAGR, 3X more than the S&P 500
-
about 2X better risk-adjusted expected returns of the S&P 500 over the next five years
I can’t tell you when SWK will bottom, or when the market will bottom.
But I can say that, based on a careful examination of the best available facts, anyone buying SWK is likely to feel like a stock market genius in 5+ years.
Be the first to comment