

cemagraphics
Last week’s article called for the S&P500 (SPY) rally to fade and drop to around 4415 which nearly played out with this week’s decline to 4430. However, Thursday’s low does not necessarily mark the bottom of this move. The title of this week’s article, ‘It’s not over,’ refers both to the probability of further declines, and to the bigger picture view that stock markets are likely stuck in a volatile range which has much further to go.
To help navigate this backdrop, a variety of tried and tested technical analysis techniques will be applied to the S&P 500 in multiple timeframes. The aim is to provide an actionable guide with directional bias, important levels, and expectations for price action. The evidence will then be compiled and used to make a call for the week(s) ahead.
S&P 500 Monthly
The September bar is very likely to form an ‘inside bar’ within the range of the August bar (which itself was nearly within the range of July). This is a useful expectation at the extremes of the 4335-4584 area, but fairly useless at other times (such as last week). Weekly/daily charts are needed to trade inside the range.
SPX Monthly (Tradingview)
Monthly resistance is 4593-4607. 4637 is the next level above, then the all-time high of 4818.
4325-35 is significant support followed by 4195-4200.
As mentioned last week, the September bar is number 9 (of a possible 9) Demark exhaustion count so will complete the signal. The dip in August was probably an early reaction, but I’d expect a more prolonged effect and longer pause.
S&P 500 Weekly
The choppy, sideways conditions are reflected in this week’s ‘inside bar.’ There is a slight bullish bias due to the week before (the ‘mother’ bar), but no real edge until a break and close beyond either 4415 or 4541.
SPX Weekly (Tradingview)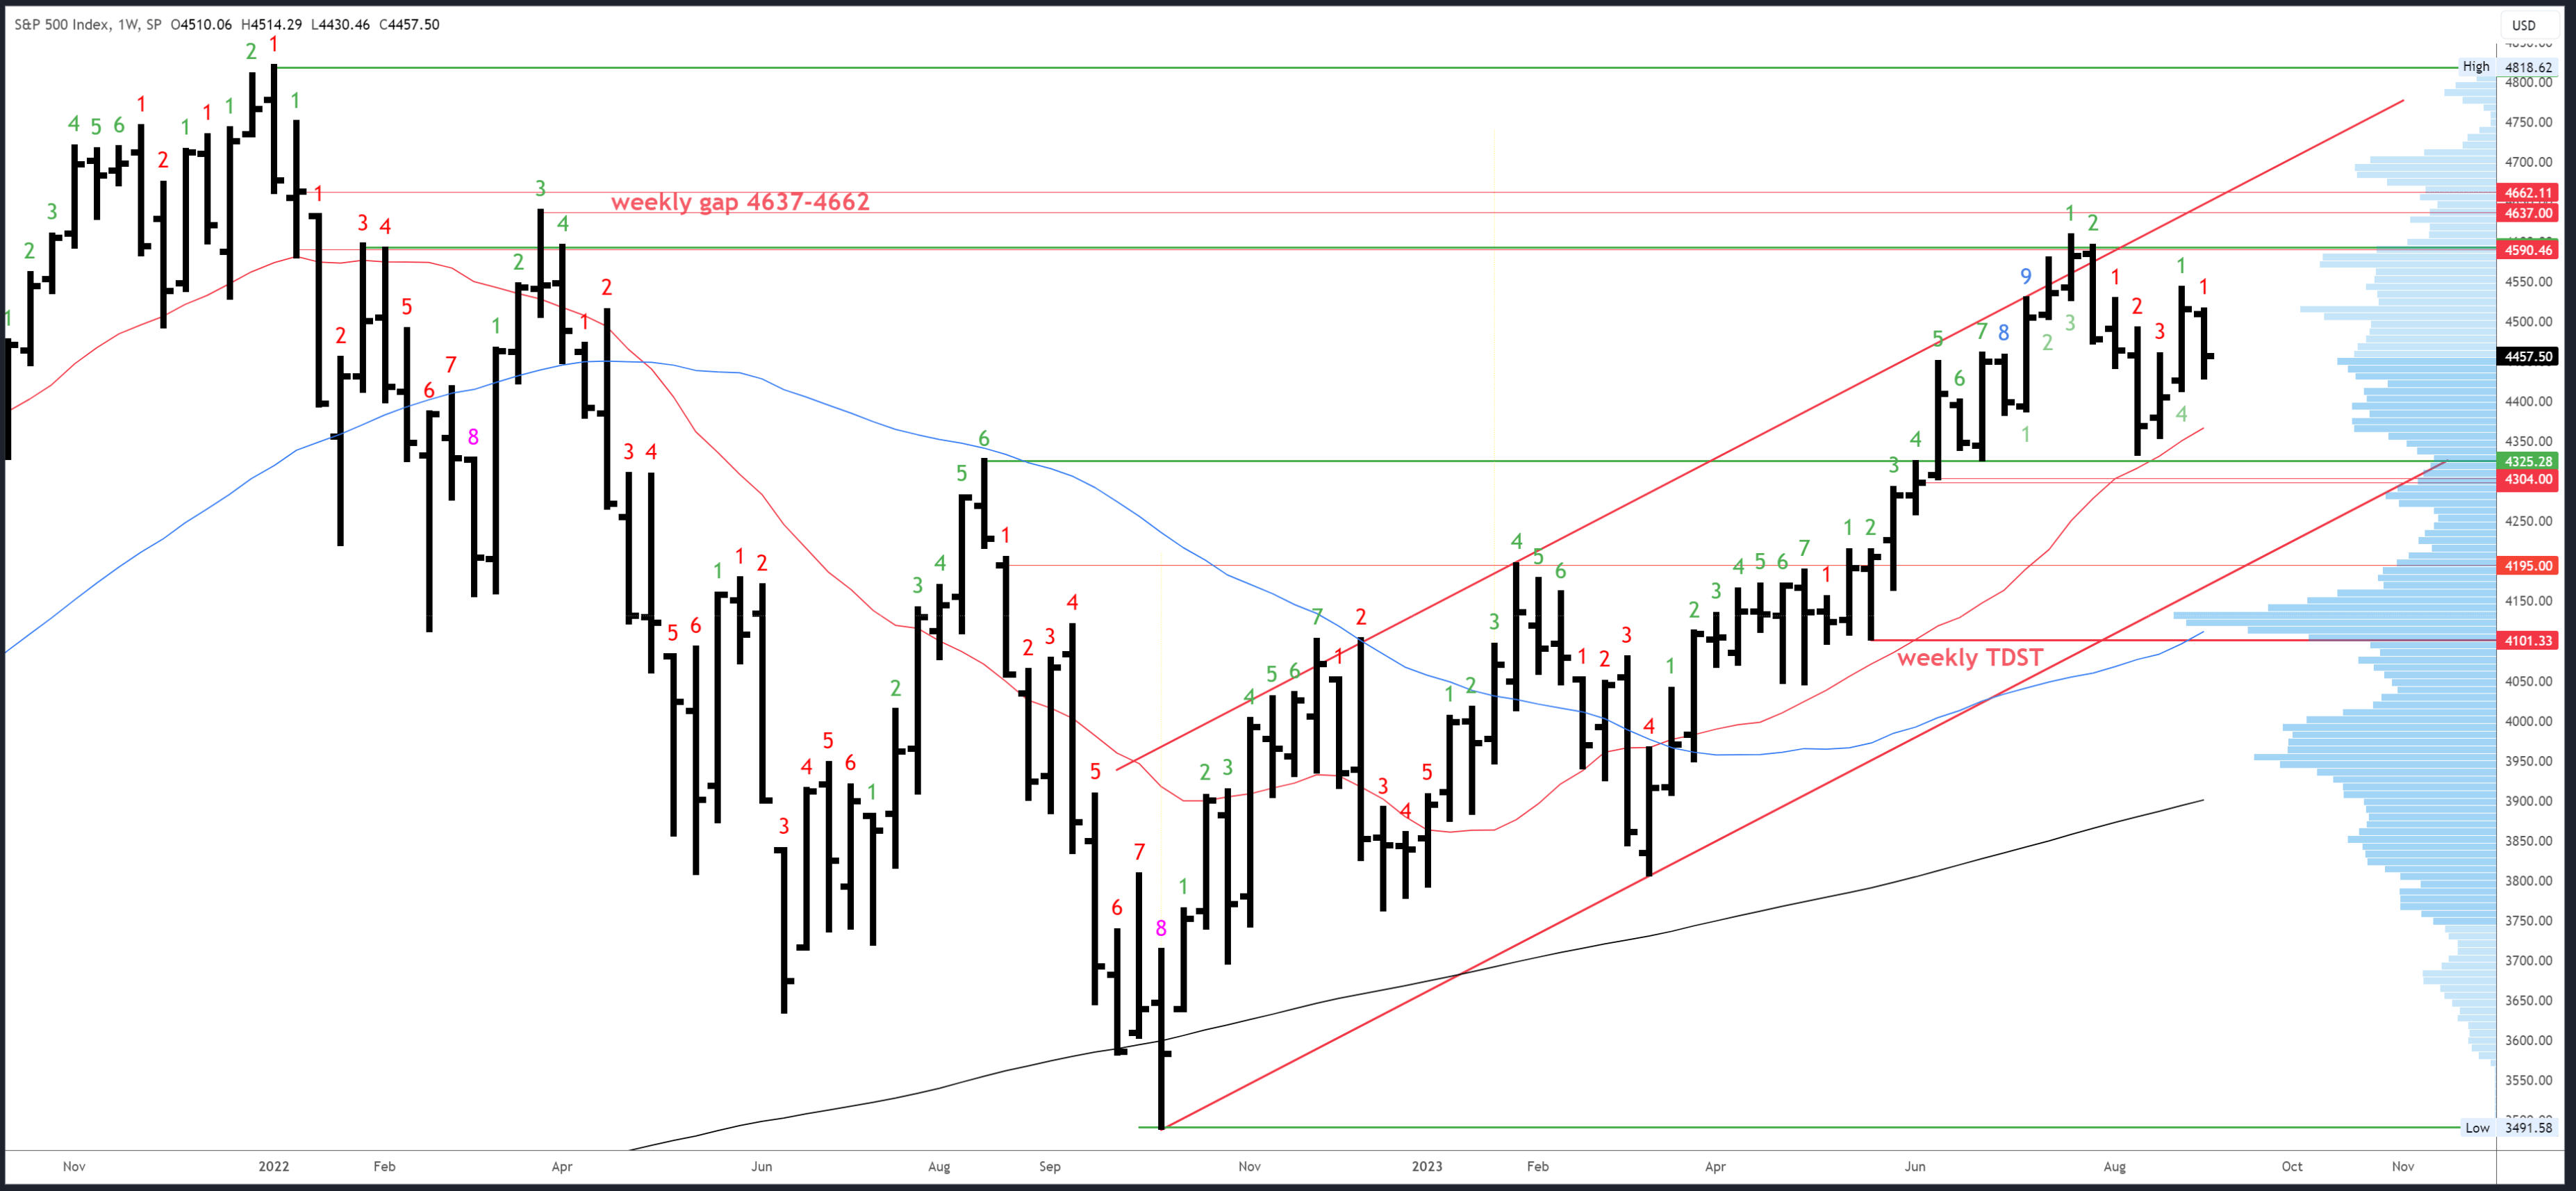
4594-4607 is the next resistance. A break of 4607 should lead to the weekly gap at 4637-4662.
A small weekly gap at 4405-4415 is the first potential support area, with 4356 below. 4325-35 remains the key level, with a small gap at 4298-4304 should this area be flushed.
An upside (Demark) exhaustion count completed in July and has already had an effect with the August drop. New counts are getting interrupted by the choppy conditions and a clean trend is needed to progress towards the next exhaustion signal.
S&P 500 Daily
Unfortunately, my target at the 4415 gap wasn’t quite reached and Thursday’s reversal came from 4430, which was the low of the 29th August and the start of the strong rally that session.
4430 likely marks an interim low of the first swing down, but I expect another swing to test lower in the range and make a stronger low. Friday’s session was not exactly a bullish end to the week.
As expected, there was no real reaction at the 20dma or 50dma which again reflects the lack of trend and the sideways tendency.
SPX Daily (Tradingview)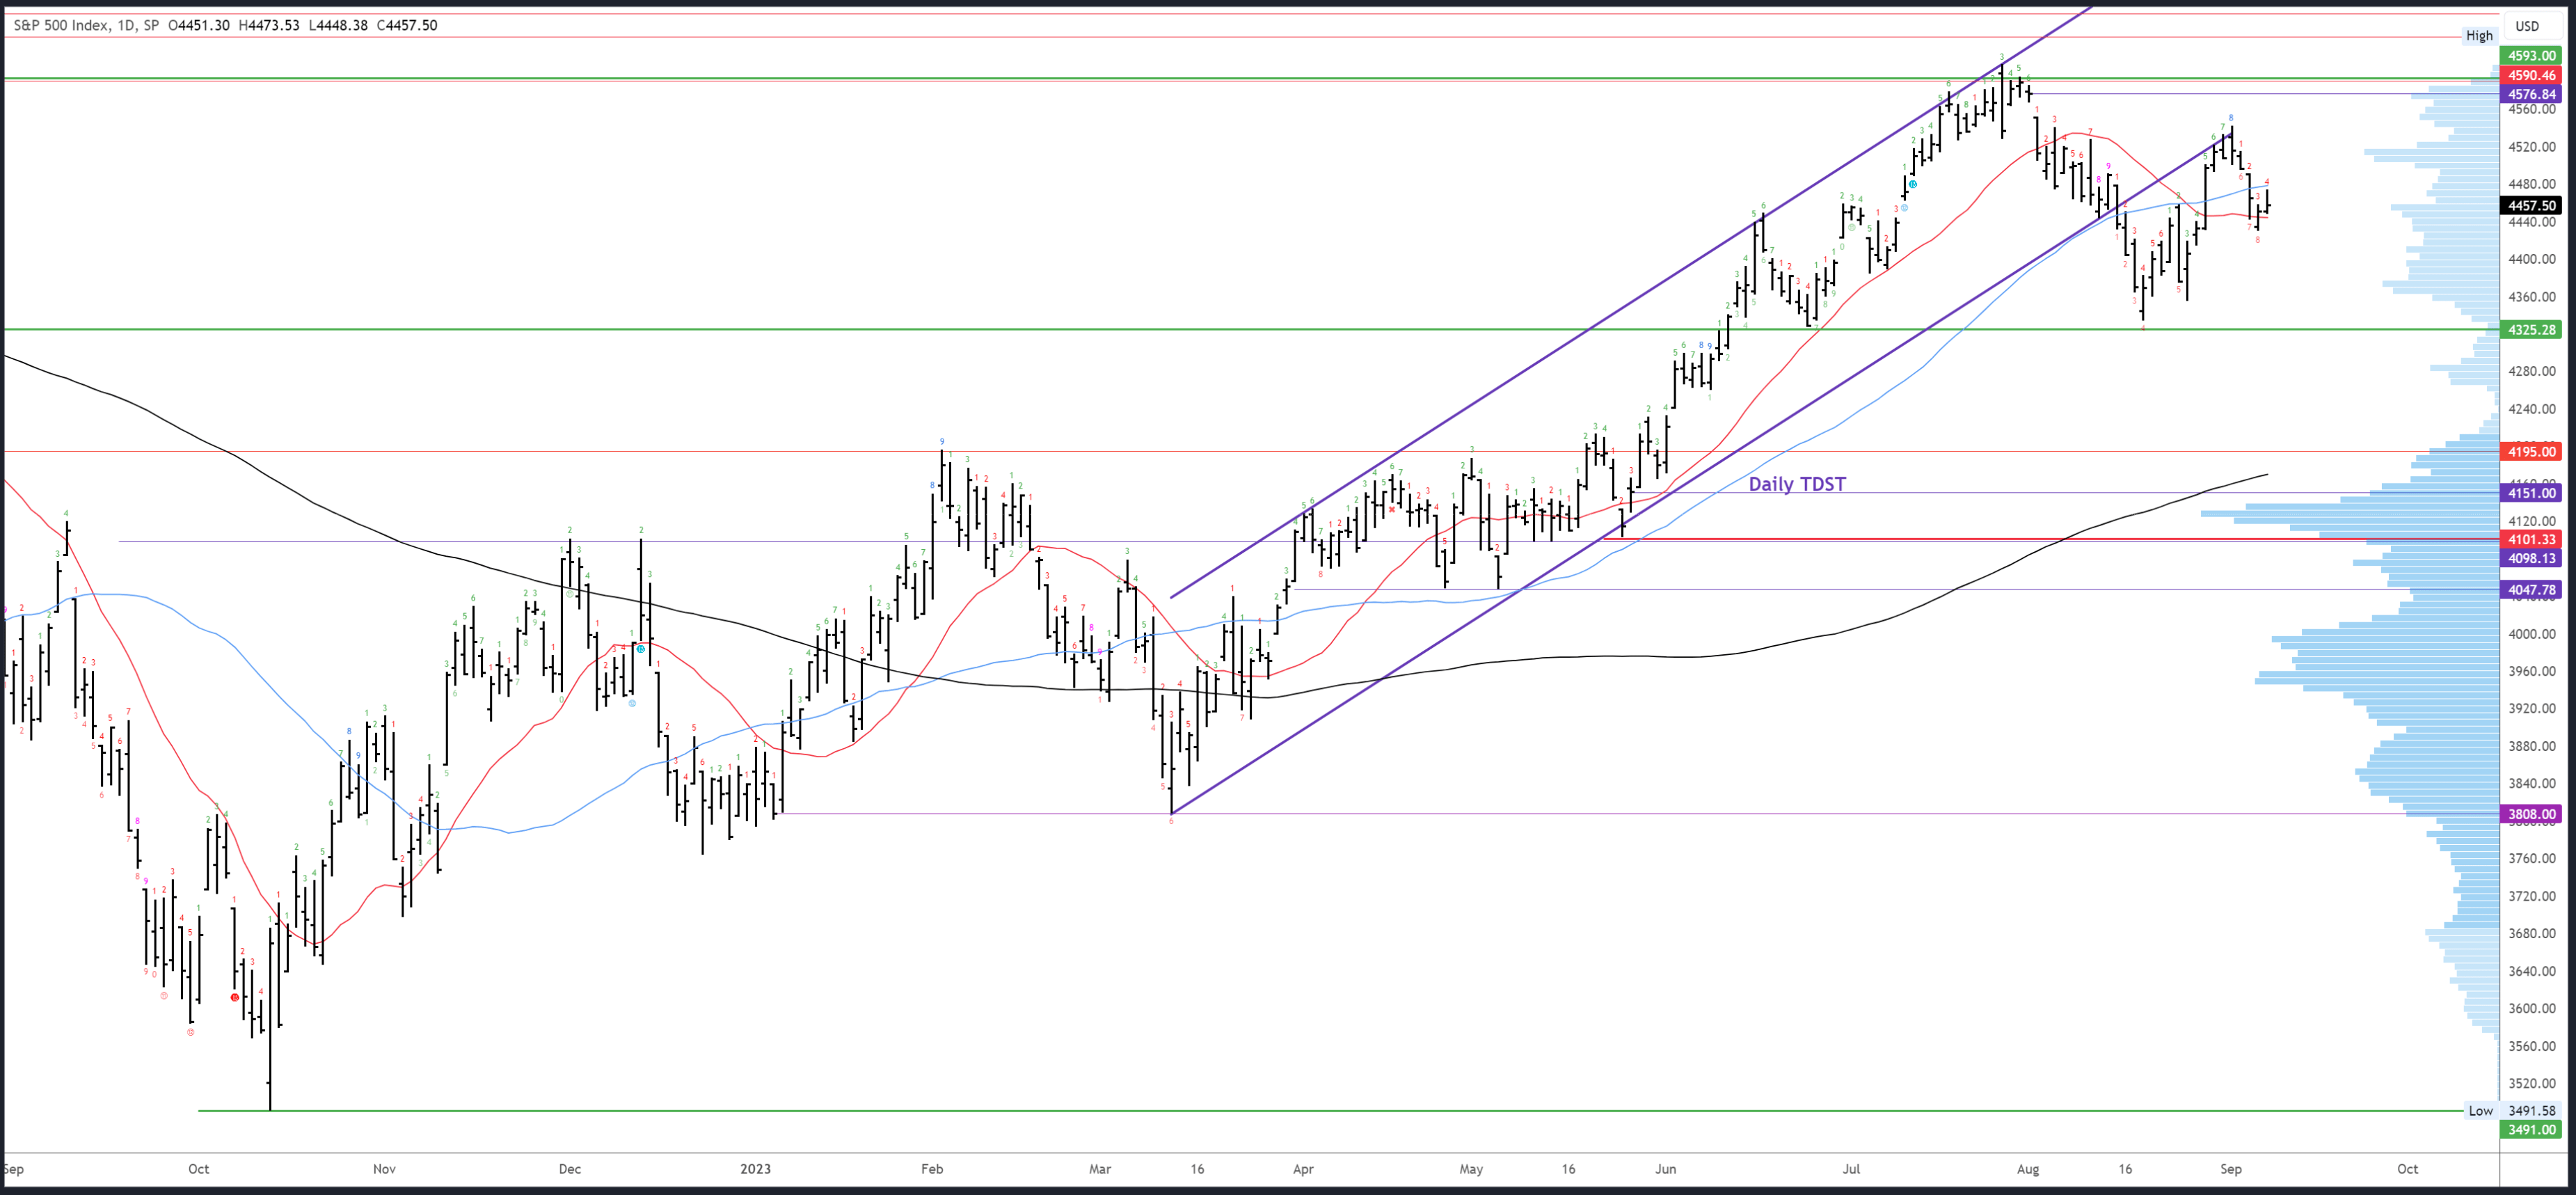
4490-4496 is the first resistance, then 4541.
Potential supports are 4415 and 4356, although 4415 is a little too close to the 4430 low and likely fails. I’m also watching the pivot level of 4397. Whether it holds or not will depend on how it is approached and the conditions of the session.
Upside Demark exhaustion did not complete last week and a downside count will be on bar 5 (of 9) on Monday. If the count continues, expect a bounce/bottom on Thursday or Friday.
Events Next Week
CPI on Wednesday and PPI on Thursday are likely to cause some short-term volatility, but I doubt they are significant enough to force a break of the trading range. The Fed (and the BoC, the RBA, the RBNZ and very soon the ECB) are almost certainly finished hiking and are buying time by touting the November and December meetings as ‘live.’ This has helped them keep yields high and kept a lid on risk assets. Sideways trading in the S&P500 is apt.
Due to the above, data is perhaps less important than before, at least in relation to near-term Fed policy. A healthy economy is now crucial as the consensus view is for growth instead of recession. Retail sales on Thursday and Consumer Sentiment on Friday could therefore be key and bulls will want to see readings come in-line or better.
Probable Moves Next Week(s)
Bigger picture, the inside monthly and weekly bars, plus the lack of reaction at the daily MAs, provides further evidence the S&P500 is trading a range. This consolidation could take some time but should set up an eventual break to new highs above 4607.
Near-term, the focus is on the swings inside the range. There has been one swing lower from the 4541 high into 4430, but this looks like only the first phase of a deeper swing and I expect another proportional drop next week.
4415 is the first target, but I prefer to buy nearer 4397 and 4356 can’t be ruled out. Obviously, it is hard to call short-term swings at the weekend and much depends on the price action leading into key levels. For instance, if Friday’s high holds for a direct and aggressive drop, I would look for 4356. On the other hand, if there is a recovery to 4490-96 first, 4397 has a better chance of holding. I will try and update in the comments section if there is any clarity later in the week.
Be the first to comment