

cemagraphics
The S&P 500 (SPY) finally broke trendline resistance and closed all five sessions last week above the break-out level. On one hand this could be significant as the trendline capped rallies for most of last year. On the other, it was a widely watched resistance point and an easy way to squeeze out some shorts. Can the break be trusted?
In an attempt to answer that, a variety of technical analysis techniques will be used to look at probable moves for the S&P 500 in the week ahead. Just like last week, the market will be viewed in probable outcomes using inflection points – if it is going down, where is it likely to go? If it is going up, where is it likely to test?
The S&P 500 chart will be analyzed on monthly, weekly and daily timeframes, then the information collated into an actionable summary at the end.
The Market Narrative
Last week’s data calendar was on the quiet side and GDP was the only top tier release in the US. This came in much stronger than expected and will raise hopes of a soft landing for the US economy. It will also give the Fed something to think about ahead of next week’s FOMC meeting. The prospect of a further inflationary impulse remains a concern and would be exacerbated by a rally in risk assets, especially if the S&P500 breaks out properly and accelerates higher. Will they risk following the BoC’s lead and announce a last 25bps followed by a pause?
S&P500 earnings have improved slightly after 143 reports with 67.8% companies beating earnings and 28.2% missing. This is still some way off average but not bad enough to weigh on the index. 108 companies will release earnings next week with Apple (AAPL), Amazon (AMZN), Meta (META) and Alphabet (GOOG) (GOOGL) all due to report. The Technology sector is expected to report a -18.5% drop from the same period last year on -2.6% lower revenue so bad news is anticipated but perhaps not fully priced in.
S&P 500 Monthly
The monthly chart finally came into play last week as Friday’s rally reached 4094, just shy of the December monthly high of 4101 and the September monthly high of 4119.
SPX Monthly (Tradingview)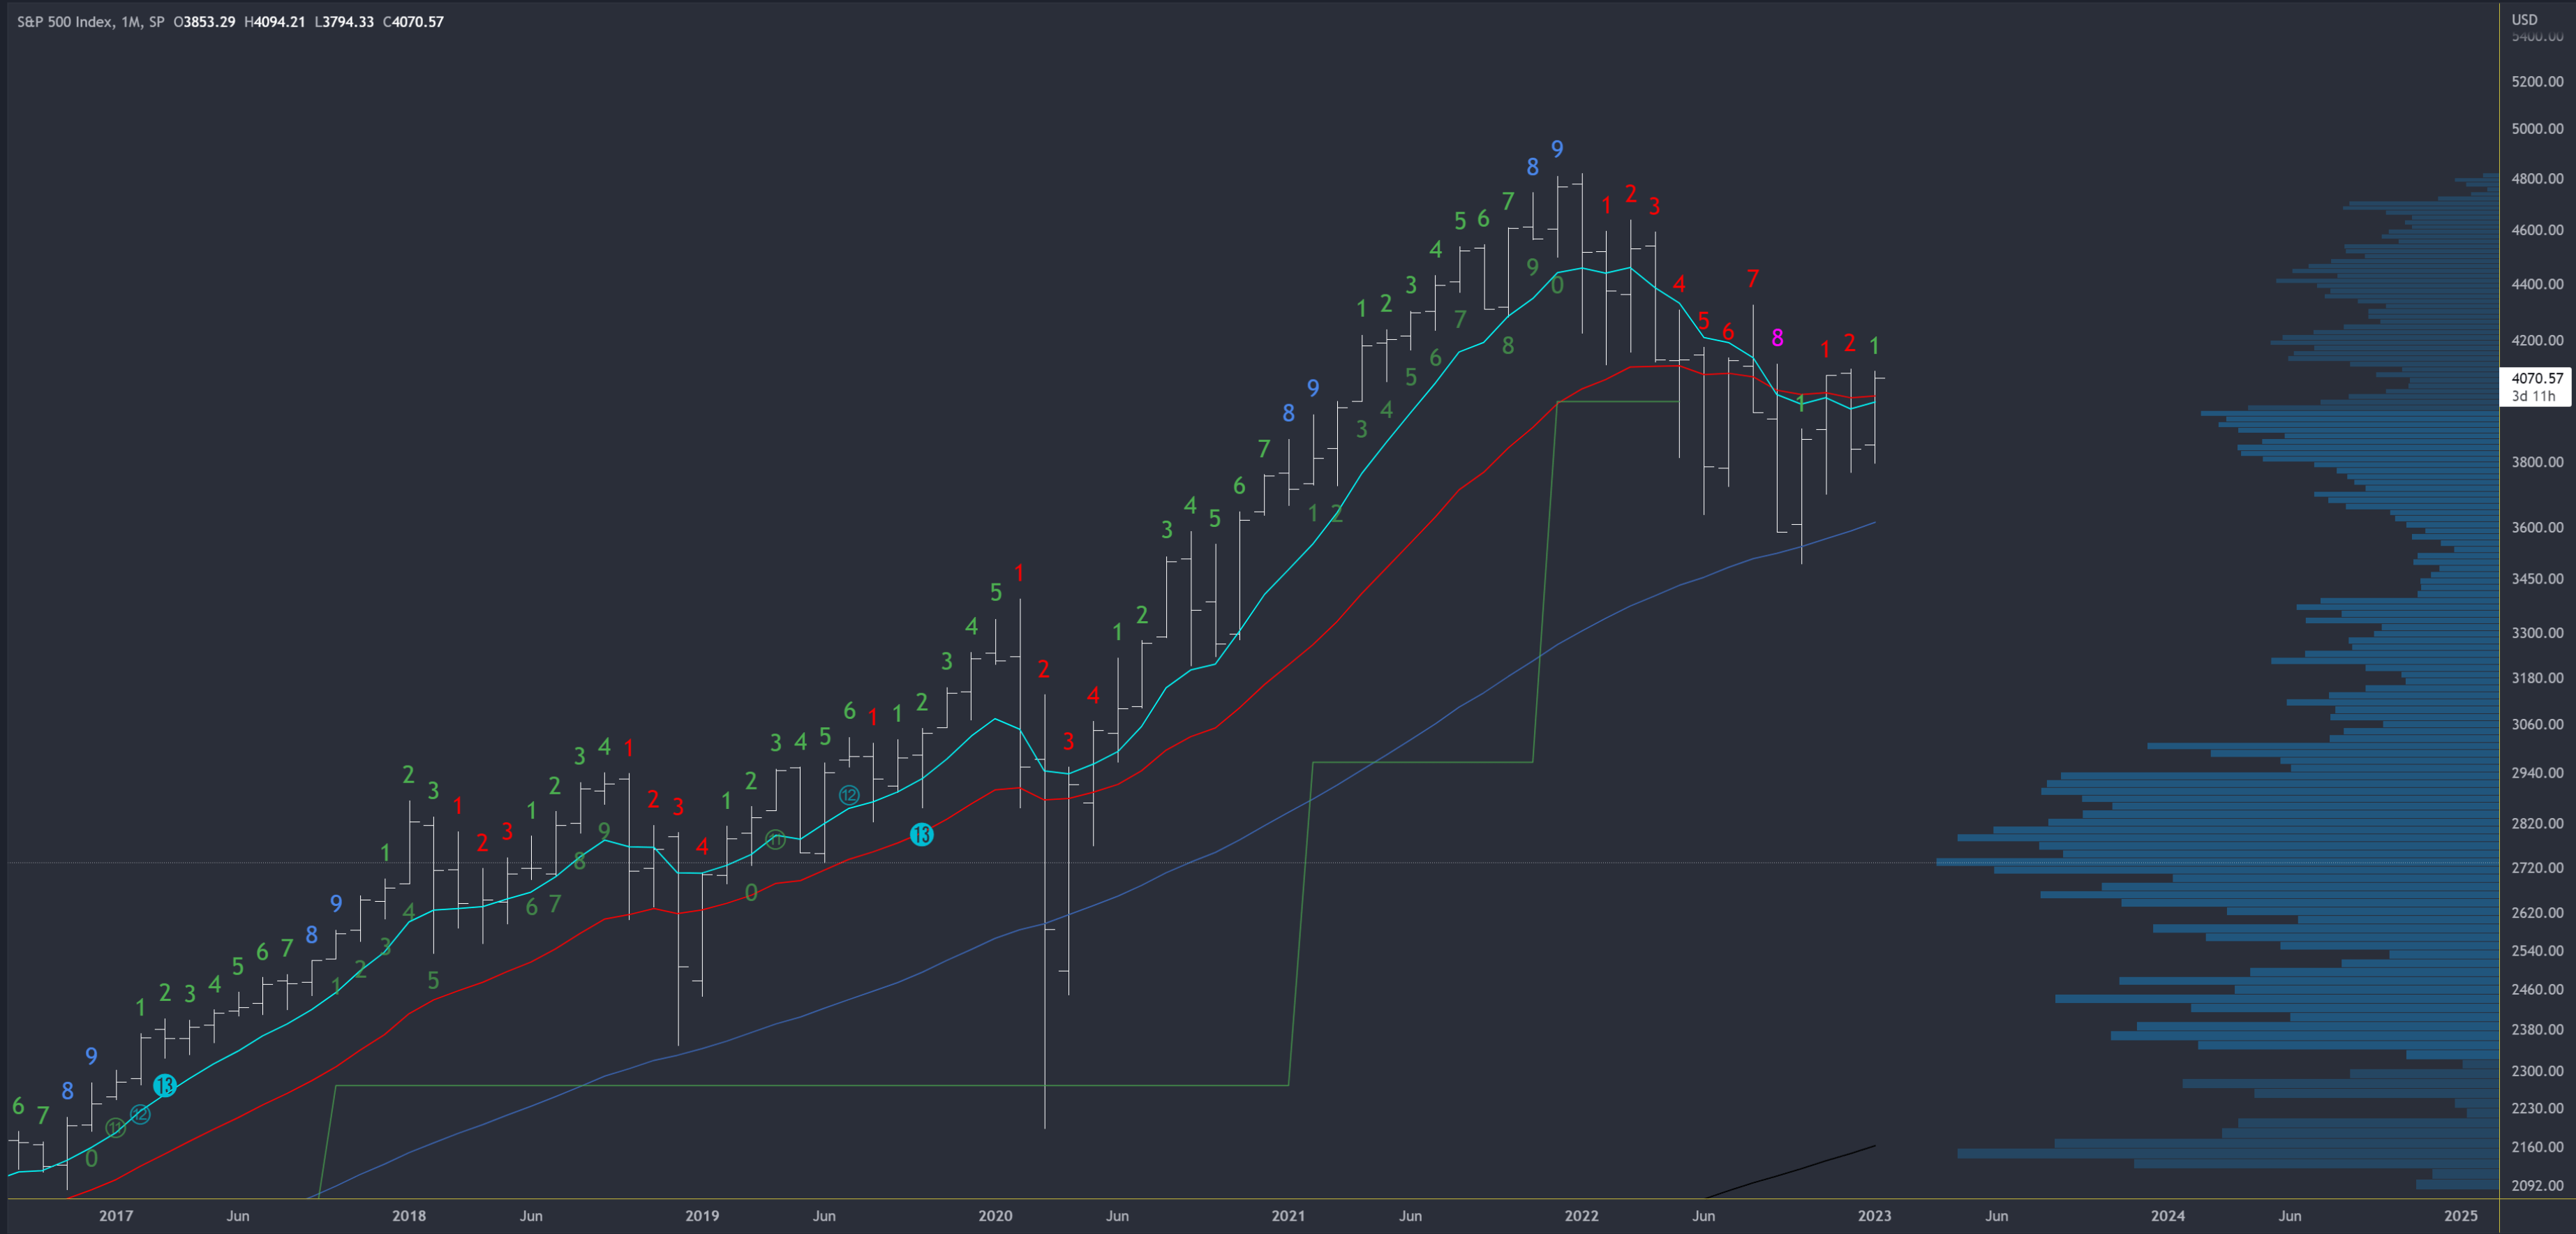
Should the SPX clear 4119, the 4325 at the high of August is the next reference. Support is at December’s low of 3764, the 50ma at 3610 and the 3491 low.
A new monthly bar for February will start on Wednesday.
There are no exhaustion signals in either direction (using Demark methods). However, the October bar nearly registered downside exhaustion on bar 9 of 9 but didn’t complete due to the bounce. The Nasdaq (QQQ), on the other hand, did complete downside exhaustion so is working that off.
S&P 500 Weekly
Last week’s rally broke above the trendline (next week around 4012) and the 50sma (next week around 4025) and closed near the highs. As long price stays above these levels, the chart is bullish.
SPX Weekly (Tradingview)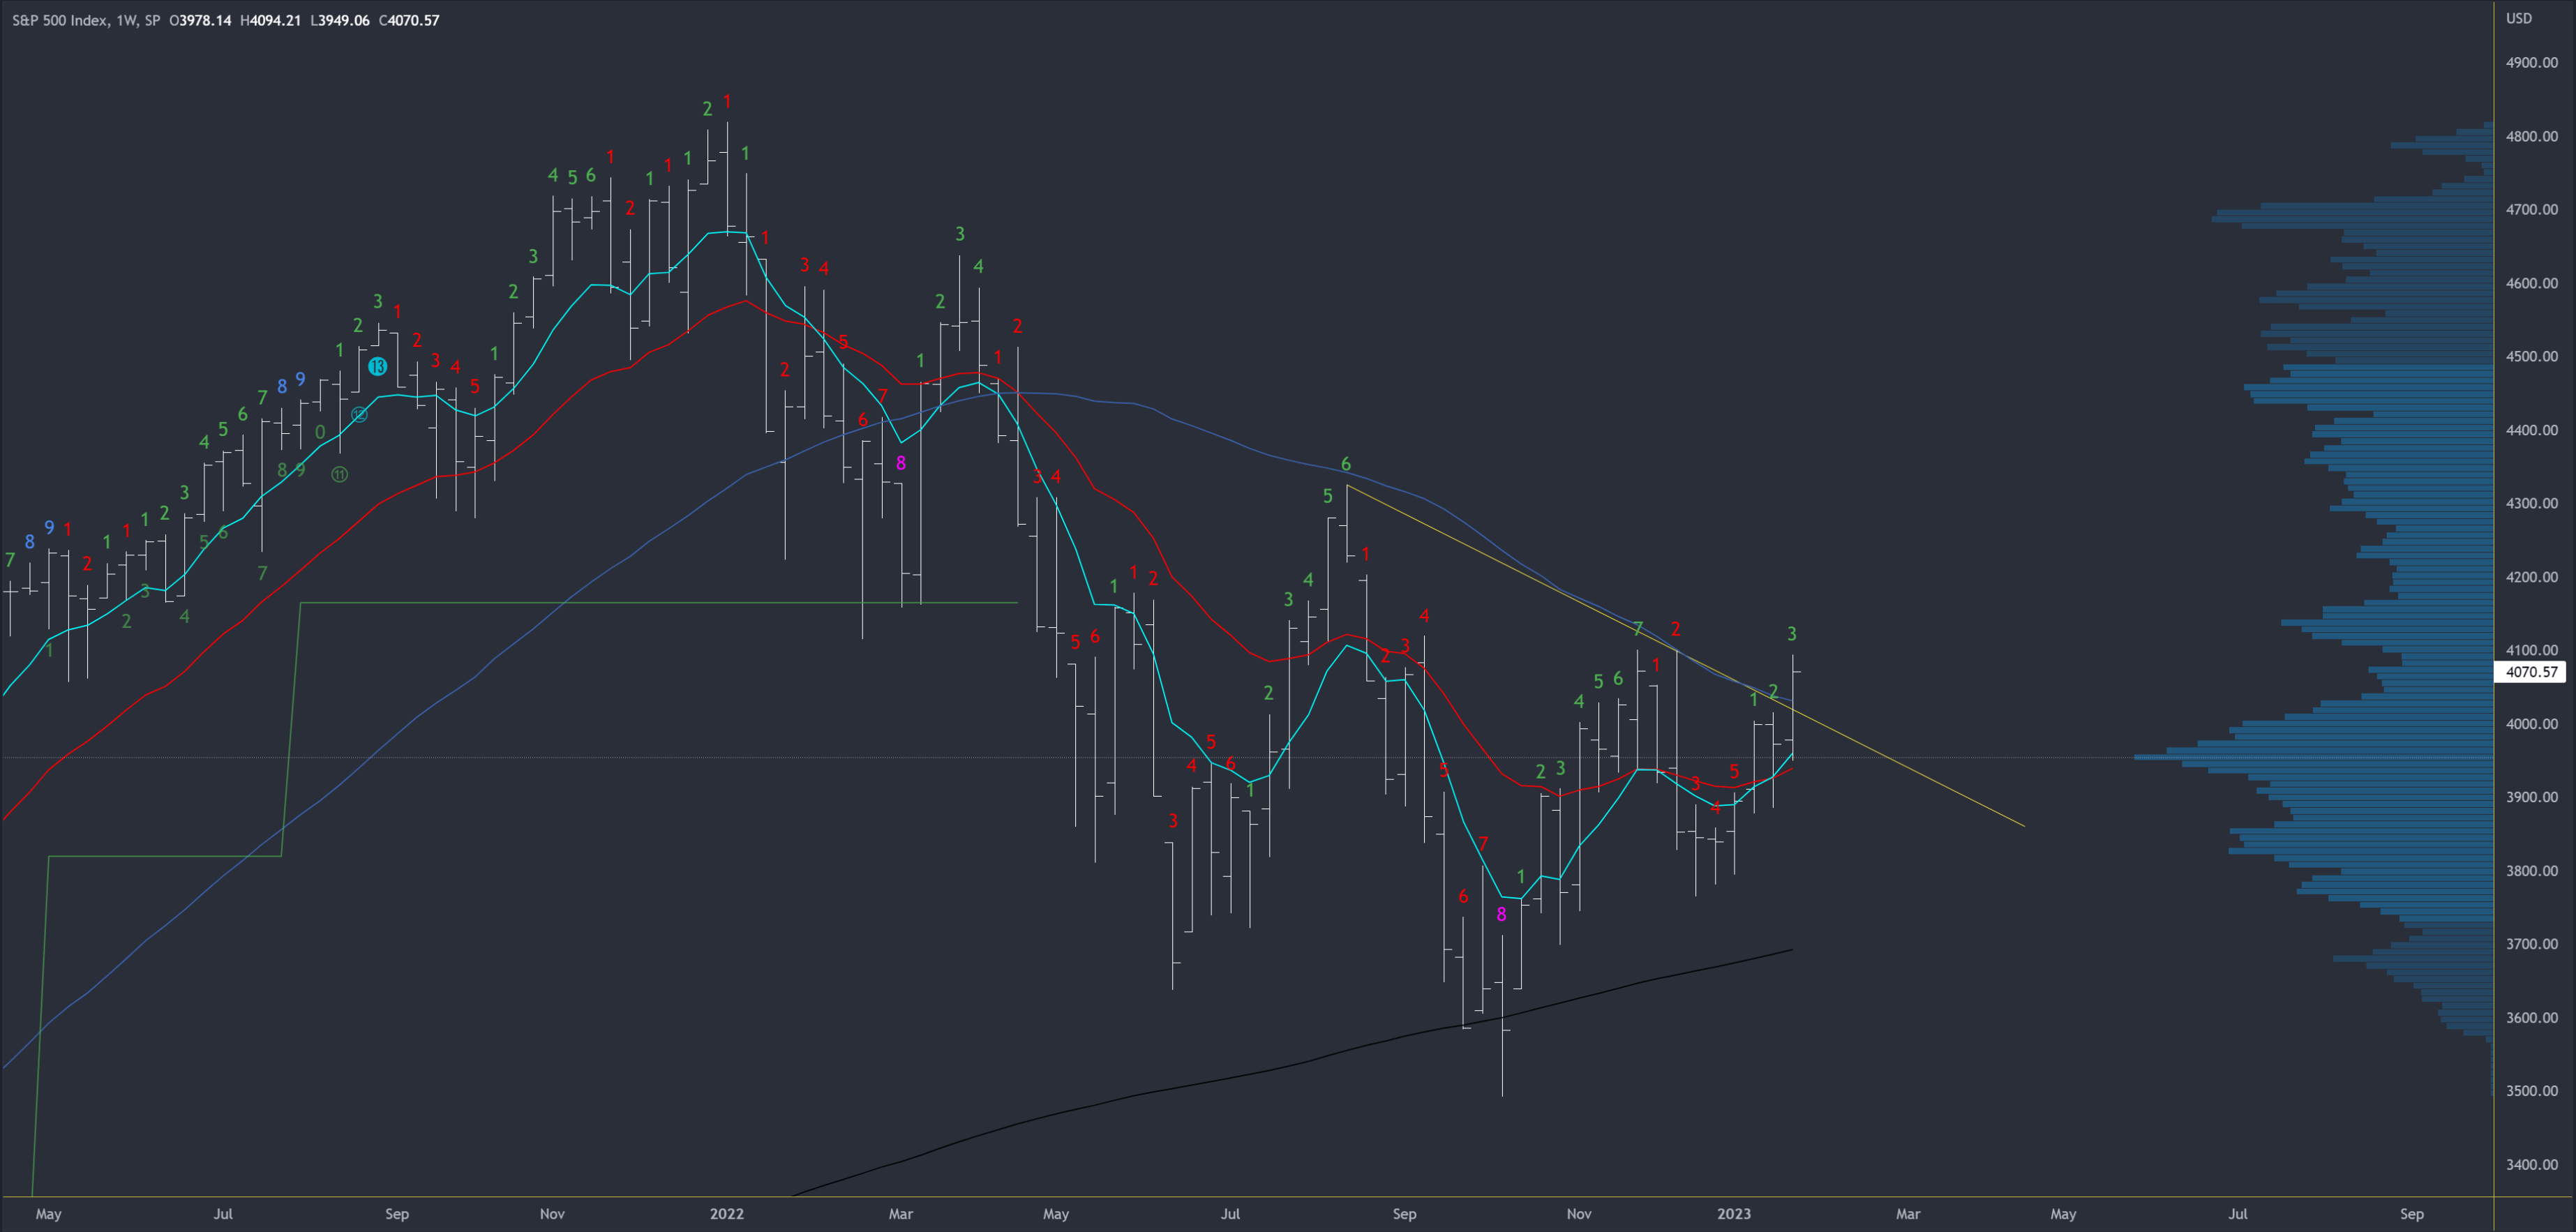
4101-19 is the next resistance, then 4203 at the large weekly gap. Support is at the 3764 pivot low and the 200ma around 3690.
Again, there are no exhaustion signals in either direction.
The trend is down (lower lows and lower highs).
S&P 500 Daily
It finally did it – the S&P500 has broken the trendline. With five closes above the break-out level and a successful re-test on Wednesday, there is evidence this is a genuine break.
SPX Daily (Tradingview)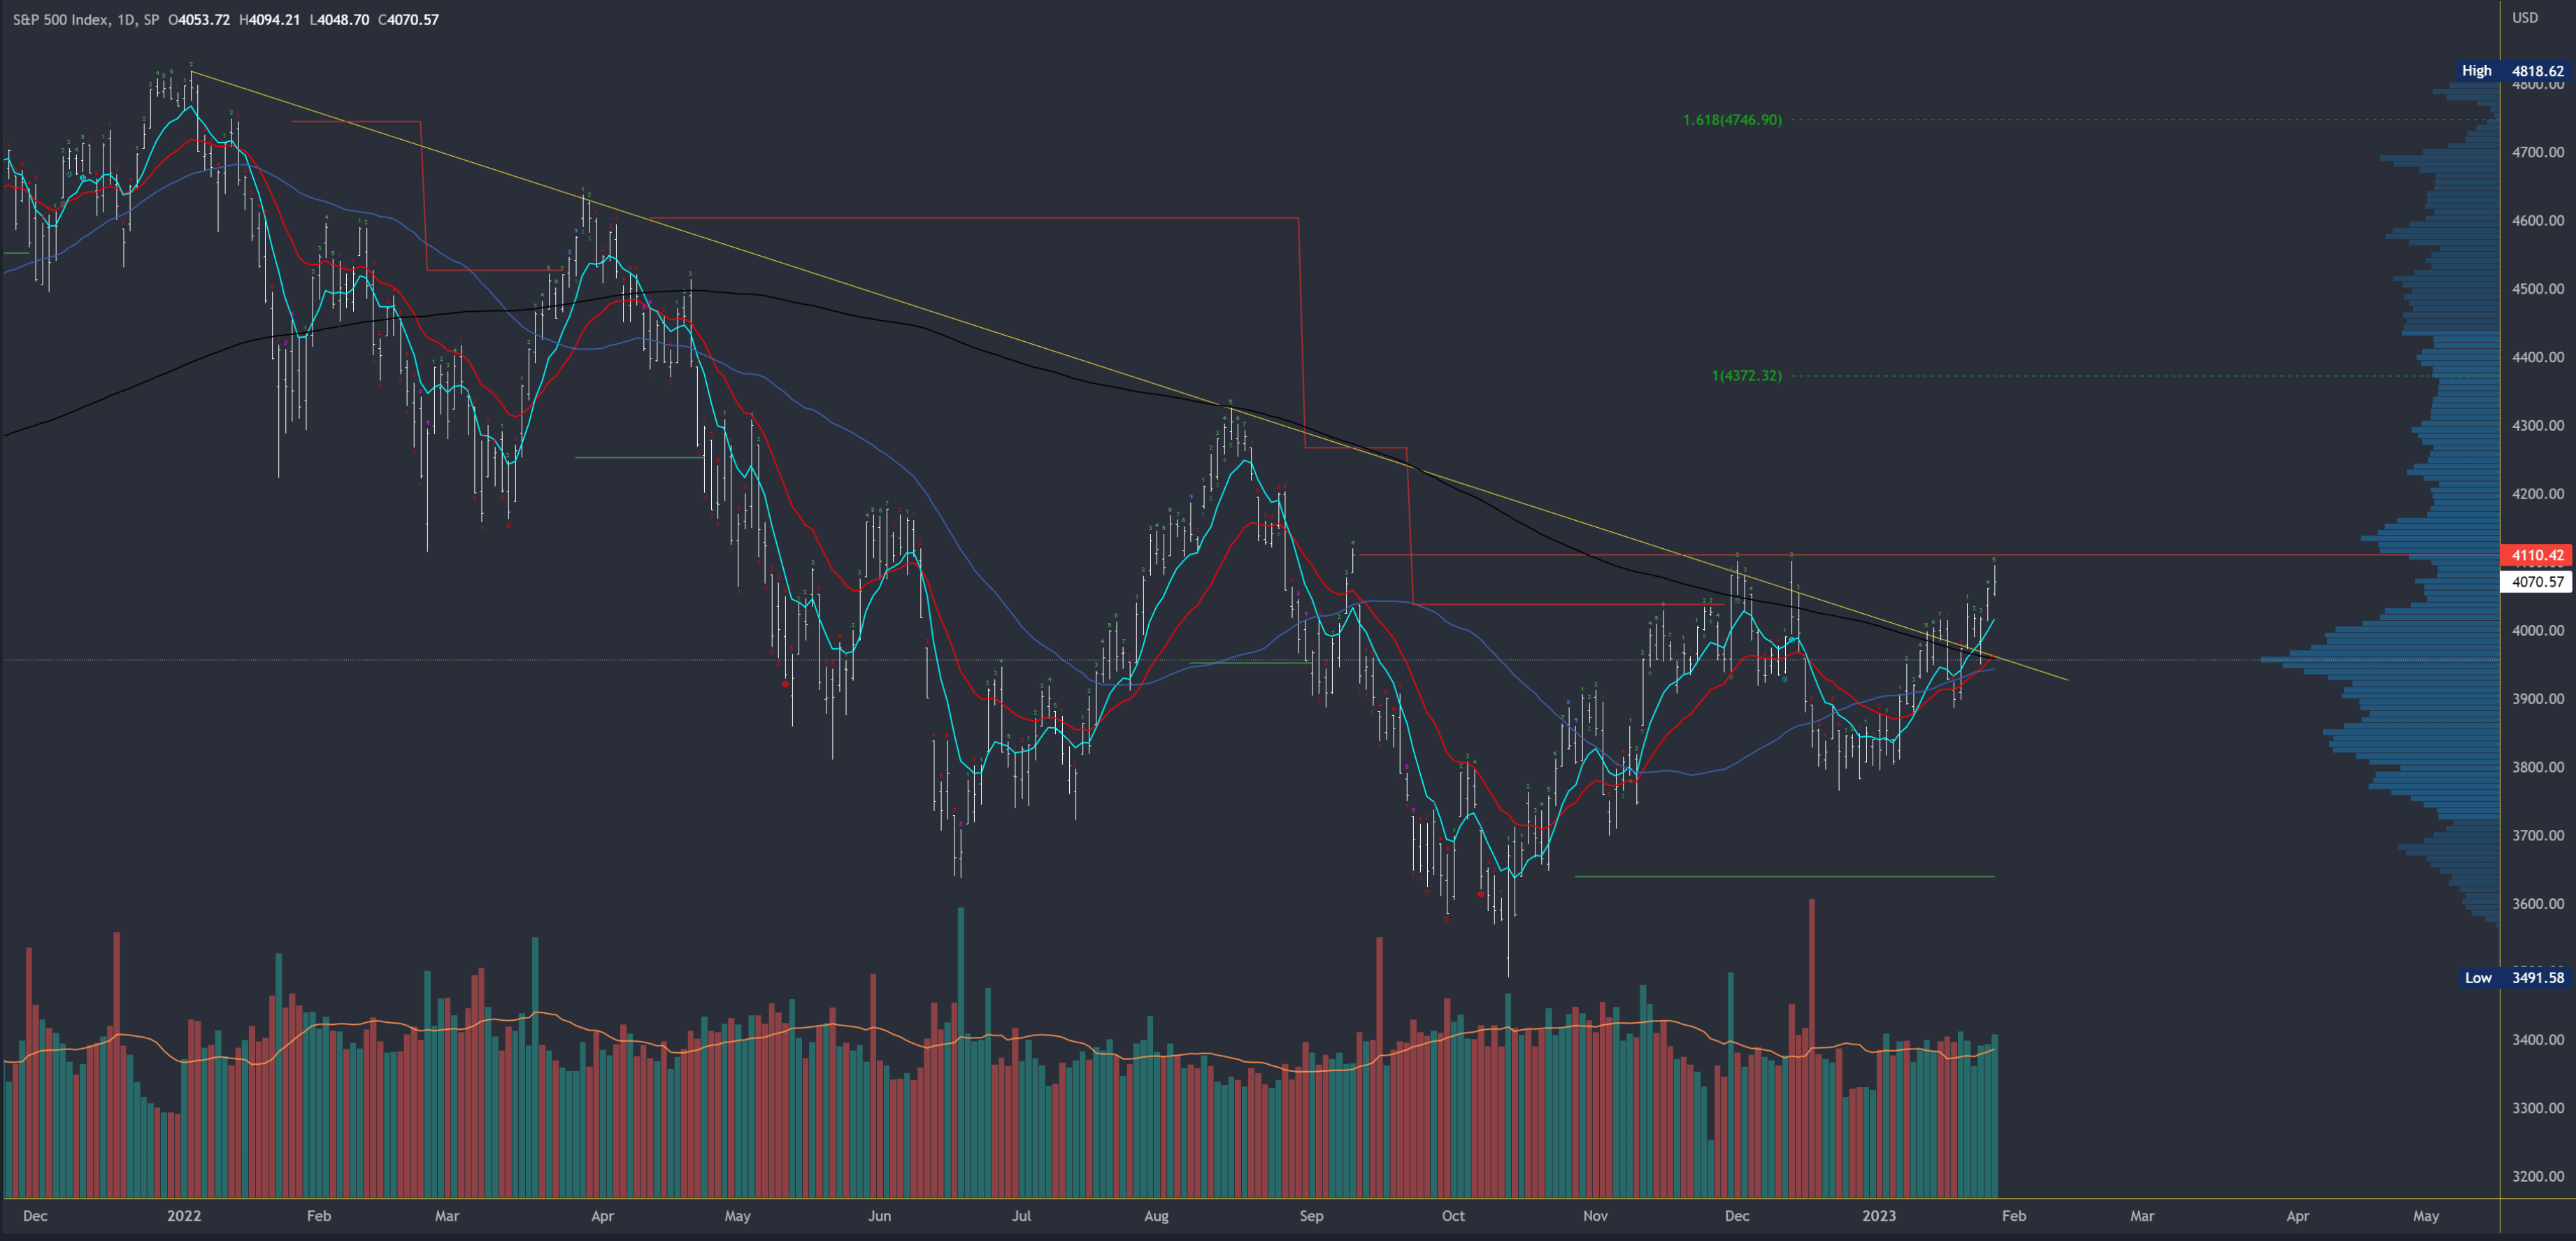
Price is now above all moving averages and if 4101 is exceeded, it would confirm a higher high and a higher low.
The monthly and weekly references are resistance. Support is at 4015, then the trendline / 200dma / last week’s low area around 3950-60, then 3885.
An upside exhaustion count will be on bar 6 on Monday and will be active on Wednesday / Thursday should the count continue.
Scenarios for Next Week
Bullish
A break of 4101-19 should lead to 4203. Bulls will aim to continue the strong closes and need to hold the break-out and 3950.
Bearish
Breaking below 3950 and into a weak close would create a nasty failed break to target 3885 and likely lower at the 3764 weekly support. With many shorts squeezed out last week and the Fed probably keen to put an end to the rally in risk assets, bears still have a chance, especially as upside exhaustion could kick in on Wednesday. A comparison with 2000-2002 shows what can happen when closely watched breakouts fail.
SPX Failed Break 2002 (Tradingview)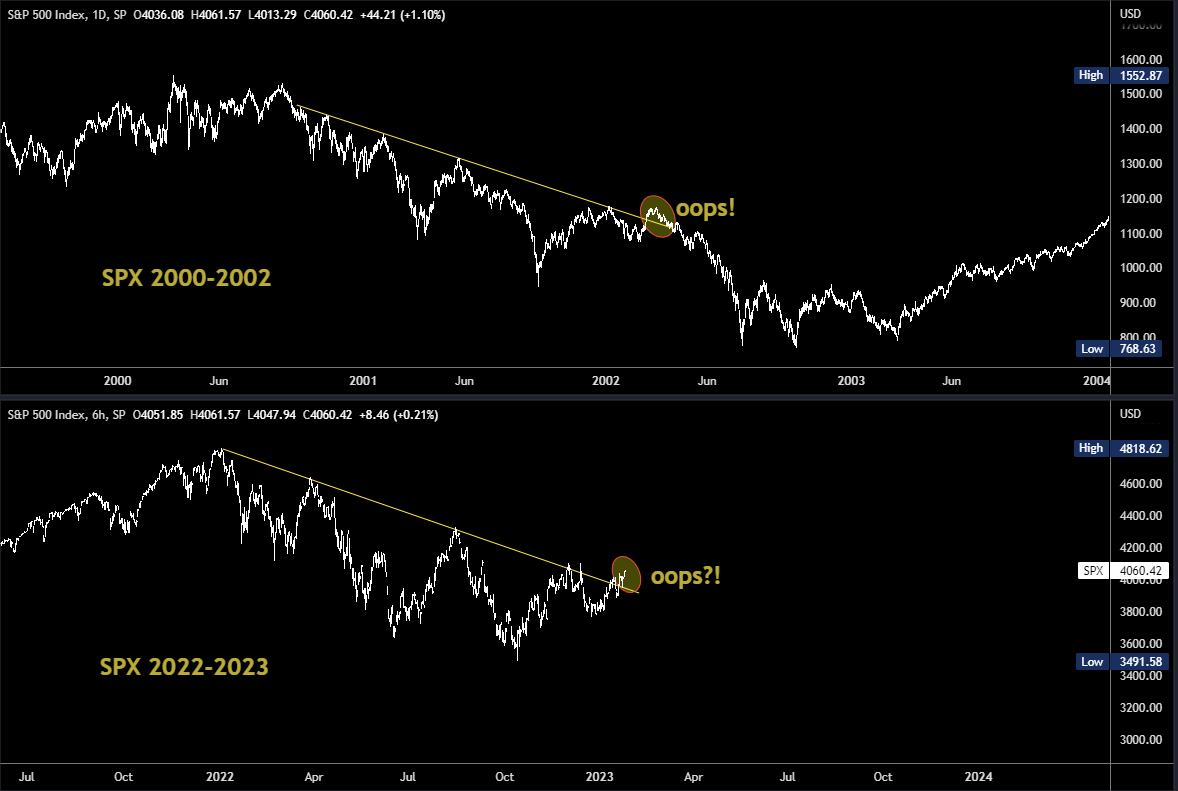
Conclusion
The S&P 500 has broken its trendline and is looking increasingly bullish as it approaches the next resistance in the 4101-19 area. However, the FOMC meeting could change all that and the charts would flip bearish under 3950.
Editor’s Note: This article covers one or more microcap stocks. Please be aware of the risks associated with these stocks.
Be the first to comment