

gorodenkoff/iStock via Getty Images
The Chart of the Day belongs to the biotechnology company Pliant Therapeutics (PLRX). I found the stock by using Barchart to sort the stocks of the Russell 3000 Index first by the most frequent number of new highs in the last month then used the Flipchart function to review the charts for consistent price appreciation. Since the Trend Spotter signaled a buy on 6/6, the stock gained 31.75%.
PLRX vs daily moving averages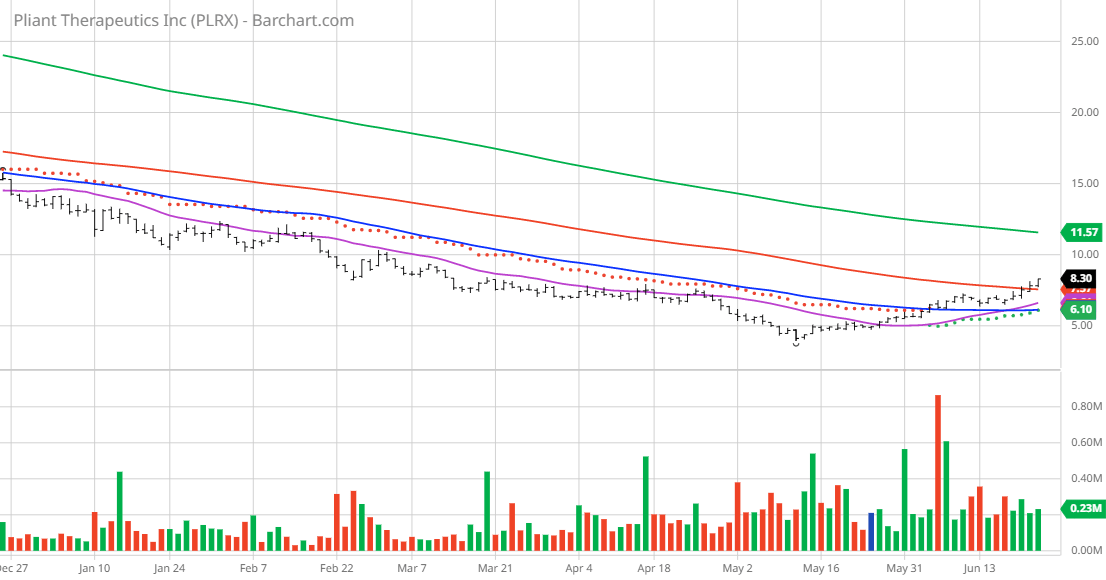
Pliant Therapeutics, Inc., a clinical stage biopharmaceutical company, discovers, develops, and commercializes novel therapies for the treatment of fibrosis and related diseases in the United States. Its lead product candidate is PLN-74809, an oral small-molecule dual selective inhibitor of avß6 and avß1 integrins, which is in three Phase 2a trials. The company also develops PLN-1474, a small-molecule selective inhibitor of avß1, which completed Phase 1 clinical trial for the treatment of liver fibrosis associated with nonalcoholic steatohepatitis.
In addition, it is developing two additional preclinical integrin-based programs, which include an oncology program, as well as a program for an allosteric agonistic monoclonal antibody against an undisclosed integrin receptor for treatment of muscular dystrophies, including Duchenne muscular dystrophy. Pliant Therapeutics, Inc. was incorporated in 2015 and is based in South San Francisco, California.
Barchart’s Opinion Trading systems are listed below. Please note that the Barchart Opinion indicators are updated live during the session every 20 minutes and can therefore change during the day as the market fluctuates. The indicator numbers shown below therefore may not match what you see live on the Barchart.com website when you read this report.
Barchart Technical Indicators:
- 24% technical sell signals but increasing toward buy
- 67.28- Weighted Alpha
- 72.09% loss in the last year
- Trend Spotter buy signal
- Above its 20, 50 and 100 day moving averages
- 14 new highs and up 68.36% in the last month
- Relative Strength Index 74.24%
- Technical support level at 7.92
- Recently traded at $8.30 with 50 day moving average of $6.13
Fundamental factors:
Analysts and Investor Sentiment – I don’t buy stocks because everyone else is buying but I do realize that if major firms and investors are dumping a stock it’s hard to make money swimming against the tide:
- Wall Street analysts give 3 strong buy, 4 buy opinions on the stock
- Analysts price targets as high as $51.00
- 1,160 investors are monitoring the stock on Seeking Alpha
Ratings Summary
Factor Grades
Quant Ranking
Sector
Industry
Ranked Overall
Ranked in Sector
Ranked in Industry
Be the first to comment