

SEASTOCK/iStock via Getty Images
The earnings per share of Mid Penn Bancorp (NASDAQ: MPB) will likely dip in 2022 due to the anticipated normalization of the provisioning for loan losses. On the other hand, a rising interest rate environment and higher average loan balances following the acquisition of Riverview Financial Corporation will likely support the bottom line. Cost savings from branch consolidation can also support earnings this year; however, I have assumed very little materialization of the expected cost savings this year to be on the safe side.
Overall, I’m expecting the company to report earnings of $2.96 per share in 2022, down from expected earnings of $2.99 per share for 2021. The year-end target price suggests a high upside from the current market price. Therefore, I’m adopting a bullish rating on Mid Penn Bancorp.
Acquisition, High Interest Rate Sensitivity to Boost the Top Line
Mid Penn Bancorp’s average loan balance will be much higher in 2022 compared to 2021 because of the acquisition of Riverview Financial Corporation that was completed on November 30, 2021, as mentioned in a press release. As can be deciphered by the details given in another press release, the acquisition would have increased the loan portfolio size by around 56%.
However, compared to period-end loans, the loan growth for 2022 will likely be subdued. This is because the upcoming forgiveness of Paycheck Protection Program (“PPP”) loans will offset new loan origination in the commercial segment. According to details given in the 10-Q filing, PPP loans made up a whopping 9.7% of total loans at the end of September 2021. I’m expecting most of these loans to get forgiven through the early part of 2022; therefore, the total loan portfolio size will likely face considerable downward pressure.
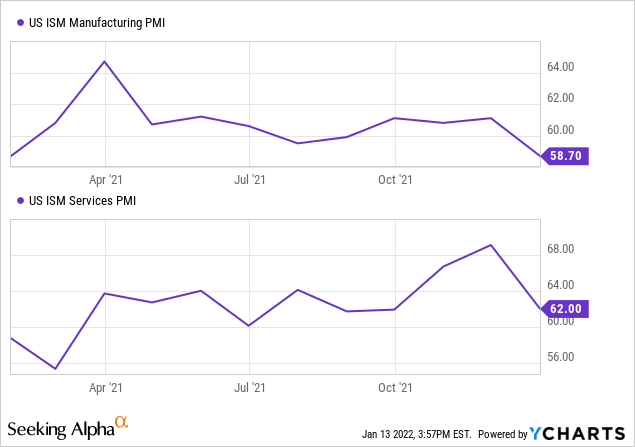
New loan origination will likely counter the impact of the PPP forgiveness. Most of Mid Penn Bancorp’s loan book is concentrated on commercial loans. Commercial and Industrial (“C&I”), Commercial Real Estate (“CRE”), and CRE construction altogether made up 88.1% of total loans at the end of September 2021. As a result, the Purchasing Managers Index, PMI, is a good metric to gauge the company’s future product demand. The following chart shows that the PMI has remained in the expansionary territory (above 50) through 2021.
Considering the factors mentioned above, I’m expecting the loan portfolio to surge by 50% in the last quarter of 2021 and increase by only 0.4% in 2022. Meanwhile, I’m expecting deposits to grow normally following a surge in the last quarter of 2021. As a result, Mid Penn Bancorp will have to park the excess funds in lower-yielding assets, leading to continued deterioration of the asset mix. The company’s asset mix worsened in the first nine months of 2021 as cash and cash equivalents surged to $754.9 million at the end of September 2021 from $303.7 million at the end of December 2020. The following table shows my balance sheet estimates.
| FY17 | FY18 | FY19 | FY20 | FY21E | FY22E | |
| Financial Position | ||||||
| Net Loans | 903 | 1,616 | 1,753 | 2,371 | 3,534 | 3,548 |
| Growth of Net Loans | 11.9% | 79.0% | 8.5% | 35.2% | 49.1% | 0.4% |
| Securities | 204 | 304 | 294 | 433 | 1,344 | 1,426 |
| Deposits | 1,024 | 1,726 | 1,912 | 2,475 | 3,702 | 3,930 |
| Borrowings and Sub-Debt | 64 | 118 | 60 | 257 | 913 | 808 |
| Common equity | 76 | 223 | 238 | 256 | 473 | 506 |
| Book Value Per Share ($) | 17.83 | 31.48 | 28.09 | 30.28 | 29.60 | 31.71 |
| Tangible BVPS ($) | 16.81 | 21.60 | 19.99 | 22.32 | 25.44 | 27.55 |
|
Source: SEC Filings, Author’s Estimates (In USD million unless otherwise specified) |
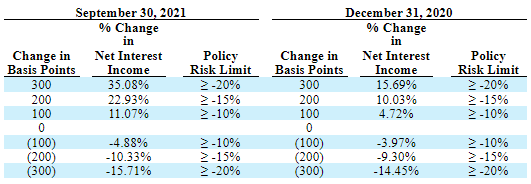
The continued deterioration of the asset mix will likely pressurize the net interest margin this year. On the plus side, the company has considerably increased its sensitivity to interest rate changes by actively managing interest-rate risk through the gap between the repricing of assets and liabilities. Mid Penn Bancorp had successfully increased the sensitivity by the end of September 2021 compared to the end of December 2020.
According to the management’s interest-rate sensitivity analysis, a 100-basis points increase in interest rates could have boosted the net interest income by only 4.72% at the end of December 2020. In comparison, a 100-basis points increase in interest rates post September 2021 can increase the net interest income by a remarkable 11.07% over 12 months. The following table from the 10-Q filing gives the details of the management’s interest-rate sensitivity analysis.
Considering these factors, I’m expecting the net interest margin to improve by four basis points in 2022.
Cost Savings to Drive Earnings of the Combined Company
As shown in the merger presentation and copied below, there’s some branch overlap between Mid Penn Bancorp and Riverview Financial Corporation’s footprints.
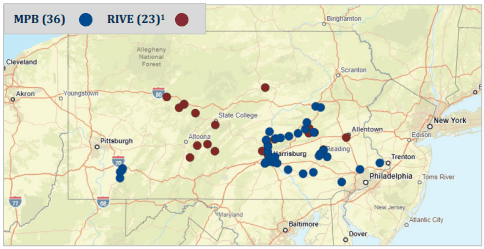
As a result, the management has planned consolidations of redundant branches. As mentioned in the merger presentation, the management has identified cost savings of around 50% of Riverview’s non-interest operating expenses. However, it is unclear how soon Mid Penn Bancorp can achieve these branch closures. Therefore, I have decided to be conservative in my assumptions. Further, the management expects to incur one-time merger-related expenses of around $16 million.
Considering these factors, I’m expecting the efficiency ratio to worsen in the fourth quarter of 2021 before improving to 62.4% in the fourth quarter of 2022 from 66.5% in 2020.
Provision Expense to be the Major Contributing Factor to an Earnings Decline This Year
The provision expense will likely normalize this year, which will counter the acquisition benefits for the bottom line. The current allowance appears at a comfortable level, neither excessive nor insufficient. Allowances made up 0.60% of total loans at the end of September 2021, which is around six times the annualized net charge-offs reported for the third quarter, as mentioned in the 10-Q filing. Further, the allowances easily cover the non-performing loans, which made up 0.29% of total loans at the end of September 2021.
The provision expense made up 0.09% of total loans from 2016 to 2019. Consequently, I’m expecting the provision expense to make up 0.10% of total loans in 2022.
Expecting 2022 Earnings of $2.96 per Share
The increase in the average loan balance, margin expansion, and cost savings will likely support earnings this year. On the other hand, a normalization of the provision expense will likely drag earnings. Further, the acquisition will have a dilution effect as the transaction was 100% stock-based. According to my calculations, Mid Penn Bancorp would have issued 4.5 million new shares to the shareholders of Riverview Financial, taking MPB’s total shares outstanding to around 16.0 million shares.
Overall, I’m expecting the company to report earnings of $2.96 per share in 2022. For the last quarter of 2021, I’m expecting the company to report earnings of $0.10 per share, which will take full-year earnings to $2.99 per share. The following table shows my income statement estimates.
| FY17 | FY18 | FY19 | FY20 | FY21E | FY22E | |
| Financial Summary | ||||||
| Net interest income | 38 | 56 | 70 | 88 | 104 | 148 |
| Provision for loan losses | 0 | 1 | 1 | 4 | 3 | 4 |
| Non-interest income | 6 | 7 | 13 | 18 | 21 | 22 |
| Non-interest expense | 31 | 50 | 60 | 71 | 85 | 107 |
| Net income – Common Sh. | 7 | 10 | 18 | 26 | 30 | 47 |
| EPS – Diluted ($) | 1.67 | 1.48 | 2.09 | 3.10 | 2.99 | 2.96 |
|
Source: SEC Filings, Author’s Estimates (In USD million unless otherwise specified) |
Actual earnings may differ materially from estimates because of the risks and uncertainties related to the COVID-19 pandemic, especially the Omicron Variant.
Adopting Bullish Rating Due to a High Price Upside
Mid Penn Bancorp is offering a dividend yield of 2.6% at the current quarterly dividend rate of $0.20 per share and an annual special dividend of $0.05 per share. The earnings and dividend estimates suggest a payout ratio of 29% for 2022, which is much below the 2016-2019 average of 38%. Therefore, there is room for a dividend hike this year. Nevertheless, I haven’t assumed an increase in the dividend level to remain on the safe side.
I’m using the historical price-to-tangible book (“P/TB”) and price-to-earnings (“P/E”) multiples to value Mid Penn Bancorp. The stock has traded at an average P/TB ratio of 1.33 in the past, as shown below.
| FY17 | FY18 | FY19 | FY20 | Average | |||||
| T. Book Value per Share ($) | 16.8 | 21.6 | 20.0 | 22.3 | |||||
| Average Market Price ($) | 28.0 | 31.3 | 25.0 | 20.8 | |||||
| Historical P/TB | 1.67x | 1.45x | 1.25x | 0.93x | 1.33x | ||||
| Source: Company Financials, Yahoo Finance, Author’s Estimates | |||||||||
Multiplying the average P/TB multiple with the forecast tangible book value per share of $27.6 gives a target price of $36.5 for the end of 2022. This price target implies a 13.2% upside from the January 12 closing price. The following table shows the sensitivity of the target price to the P/TB ratio.
| P/TB Multiple | 1.13x | 1.23x | 1.33x | 1.43x | 1.53x |
| TBVPS – Dec 2022 ($) | 27.6 | 27.6 | 27.6 | 27.6 | 27.6 |
| Target Price | 31.0 | 33.8 | 36.5 | 39.3 | 42.0 |
| Market Price | 32.3 | 32.3 | 32.3 | 32.3 | 32.3 |
| Upside/(Downside) | (3.9)% | 4.7% | 13.2% | 21.7% | 30.3% |
| Source: Author’s Estimates |
The stock has traded at an average P/E ratio of around 14.2x in the past, as shown below.
| FY17 | FY18 | FY19 | FY20 | Average | |||||
| Earnings per Share ($) | 1.67 | 1.48 | 2.09 | 3.10 | |||||
| Average Market Price ($) | 28.0 | 31.3 | 25.0 | 20.8 | |||||
| Historical P/E | 16.8x | 21.2x | 12.0x | 6.7x | 14.2x | ||||
| Source: Company Financials, Yahoo Finance, Author’s Estimates | |||||||||
Multiplying the average P/E multiple with the forecast earnings per share of $2.96 gives a target price of $41.9 for the end of 2022. This price target implies a 30% upside from the January 12 closing price. The following table shows the sensitivity of the target price to the P/E ratio.
| P/E Multiple | 12.2x | 13.2x | 14.2x | 15.2x | 16.2x |
| EPS – 2022 ($) | 2.96 | 2.96 | 2.96 | 2.96 | 2.96 |
| Target Price | 36.0 | 39.0 | 41.9 | 44.9 | 47.9 |
| Market Price | 32.3 | 32.3 | 32.3 | 32.3 | 32.3 |
| Upside/(Downside) | 11.6% | 20.8% | 30.0% | 39.2% | 48.4% |
| Source: Author’s Estimates |
Equally weighting the target prices from the two valuation methods gives a combined target price of $39.2, which implies a 21.6% upside from the current market price. Adding the forward dividend yield gives a total expected return of 24.2%. Hence, I’m adopting a bullish rating on Mid Penn Bancorp.
Be the first to comment