

arlutz73/iStock Editorial via Getty Images
Hershey (NYSE:HSY) is a wonderful business that just about everyone in the United States knows and loves. Hershey plays on brand recognition, nostalgia from your memories growing up, and that little bit of indulgence after a long day. Those are three powerful ingredients to the Hershey business.
Their experience and ability to truly look long-term thanks to The Hershey Trust Company owning a significant portion of the company. That long-term focus on what’s best for the business in the future has allowed Hershey to reach some pretty remarkable milestones leading the S&P Food sector in gross and operating profit margin.
Hershey CAGNY Conference (Hershey CAGNY Conference)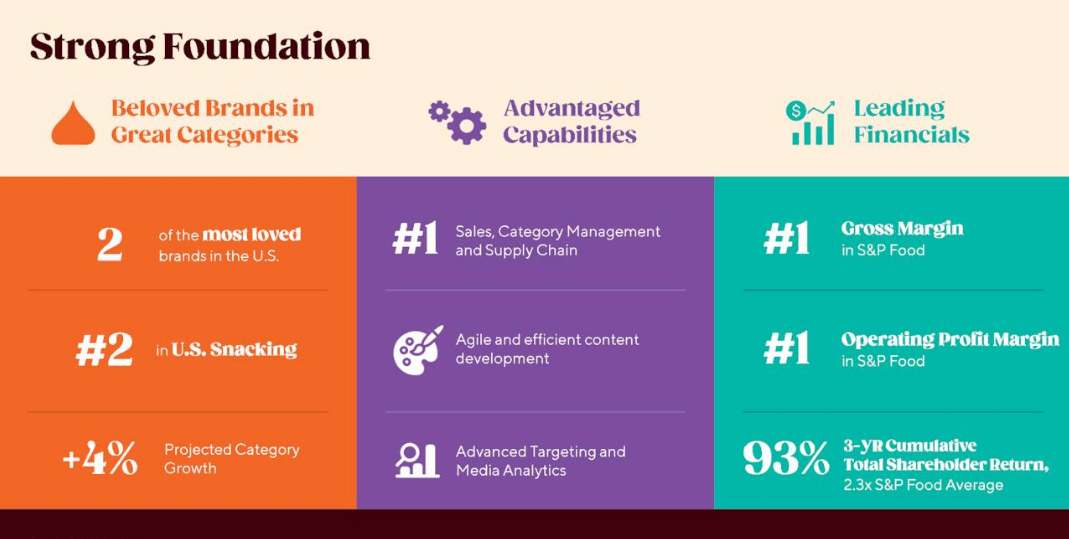
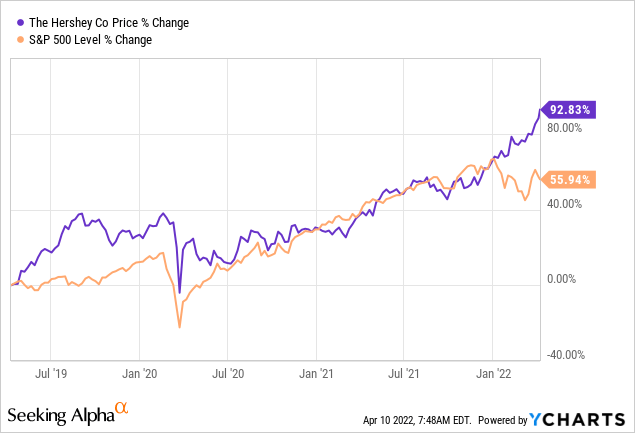
Hershey’s stock has been on a quite a run lately with significant outperformance versus the S&P 500 coming since the turn of the year. Not bad for a boring, consumer staple business.
While Hershey is the number one confectioner in the US with their eponymous Hershey brands, Kiss, and Reese’s, they’ve also been adding brands on the savory side of snacking through acquisitions. Some of the brands that have been acquired are Skinny Pop, Pirates Booty, Paqui and more.
Dividend History
Dividend growth investing is my primary investment strategy. The strategy is simple in practice: (1) buy quality businesses with a history of growing their dividends (2) then do nothing until the facts change. It’s a strategy that matches well with my temperament when it comes to investing and one that I’ve never felt worried implementing.
Hershey Dividend History (Hershey Investor Relations)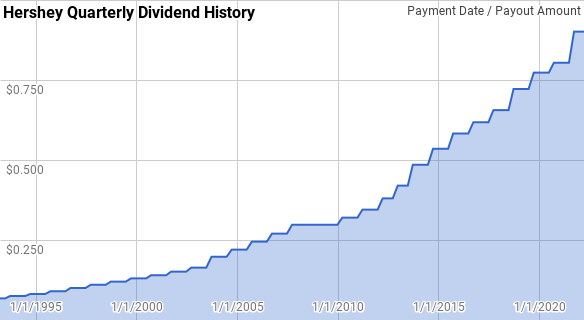
Hershey’s dividend growth streak has been quite remarkable and steady despite the pause in dividend growth in 2009. After resuming annual dividend growth in 2010, their dividend growth streak is now up to 12 years giving them the title of Dividend Contender. Although they’ve paid the same or higher annual dividend dating back to at least 1993.
Since 1993 year over year dividend growth has ranged from 0.0% to 16.0% with an average of 9.3% and a median of 9.1%.
Over that same timeframe there’s been 24 rolling 5-year periods with annualized dividend growth from Hershey ranging from 6.0% to 12.5% with an average of 9.4% and a median of 9.5%.
There’s also been 19 rolling 10-year periods with annualized dividend growth ranging from 8.4% to 10.5% with an average and median of 9.5%.
The rolling 1-, 3-, 5- and 10-year period annualized dividend growth rates from Hershey since 1993 can be found in the following table.
| Year | Annual Dividend | 1 Year DGR | 3 Year DGR | 5 Year DGR | 10 Year DGR |
| 1993 | $0.285 | ||||
| 1994 | $0.313 | 9.68% | |||
| 1995 | $0.343 | 9.60% | |||
| 1996 | $0.380 | 10.92% | 10.06% | ||
| 1997 | $0.420 | 10.53% | 10.35% | ||
| 1998 | $0.460 | 9.52% | 10.32% | 10.05% | |
| 1999 | $0.500 | 8.70% | 9.58% | 9.85% | |
| 2000 | $0.540 | 8.00% | 8.74% | 9.53% | |
| 2001 | $0.583 | 7.89% | 8.19% | 8.92% | |
| 2002 | $0.630 | 8.17% | 8.02% | 8.45% | |
| 2003 | $0.723 | 14.66% | 10.20% | 9.45% | 9.75% |
| 2004 | $0.835 | 15.55% | 12.75% | 10.80% | 10.32% |
| 2005 | $0.930 | 11.38% | 13.85% | 11.49% | 10.50% |
| 2006 | $1.030 | 10.75% | 12.54% | 12.07% | 10.49% |
| 2007 | $1.135 | 10.19% | 10.77% | 12.49% | 10.45% |
| 2008 | $1.190 | 4.85% | 8.56% | 10.49% | 9.97% |
| 2009 | $1.190 | 0.00% | 4.93% | 7.34% | 9.06% |
| 2010 | $1.280 | 7.56% | 4.09% | 6.60% | 9.01% |
| 2011 | $1.380 | 7.81% | 5.06% | 6.03% | 9.01% |
| 2012 | $1.560 | 13.04% | 9.44% | 6.57% | 9.49% |
| 2013 | $1.810 | 16.03% | 12.24% | 8.75% | 9.62% |
| 2014 | $2.040 | 12.71% | 13.92% | 11.38% | 9.34% |
| 2015 | $2.236 | 9.61% | 12.75% | 11.80% | 9.17% |
| 2016 | $2.402 | 7.42% | 9.89% | 11.72% | 8.84% |
| 2017 | $2.548 | 6.08% | 7.69% | 10.31% | 8.42% |
| 2018 | $2.756 | 8.16% | 7.22% | 8.77% | 8.76% |
| 2019 | $2.990 | 8.49% | 7.57% | 7.95% | 9.65% |
| 2020 | $3.154 | 5.48% | 7.37% | 7.12% | 9.44% |
| 2021 | $3.410 | 8.12% | 7.36% | 7.26% | 9.47% |
Source: Author; Data Source: Hershey Investor Relations
The dividend payout ratio is a quick way to judge the sustainability of a dividend as well as its potential to be raised in the future. The smaller portion of profits or free cash flow that is committed to the dividend the larger the cushion for the inevitable fluctuations of the business.
Hershey Dividend Payout Ratios (Hershey SEC filings)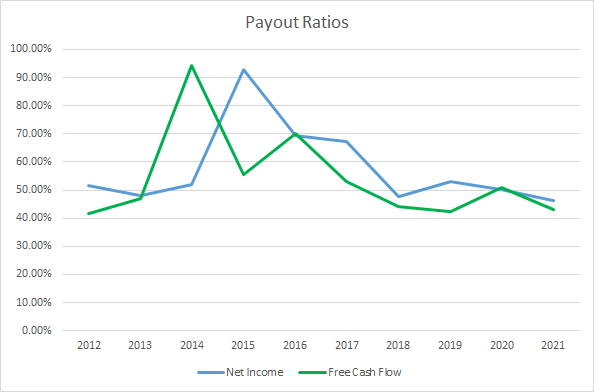
Outside of FY 2014 and FY 2015 Hershey’s payout ratios have been fairly stable. The 10-year average net income payout ratio is 57.8% with the 5-year average at 52.9%. Similarly, the average free cash flow payout ratios are 54.2% and 46.7%, respectively. Hershey’s dividend has historically been well-covered by both net income and free cash flow.
Quantitative Quality
A lengthy dividend growth history is just one data point to help us focus on likely high quality businesses. There’s several other financial metrics that I examine to help me get a sense of the business.
Hershey Revenue Profits and Cash Flow (Hershey SEC filings)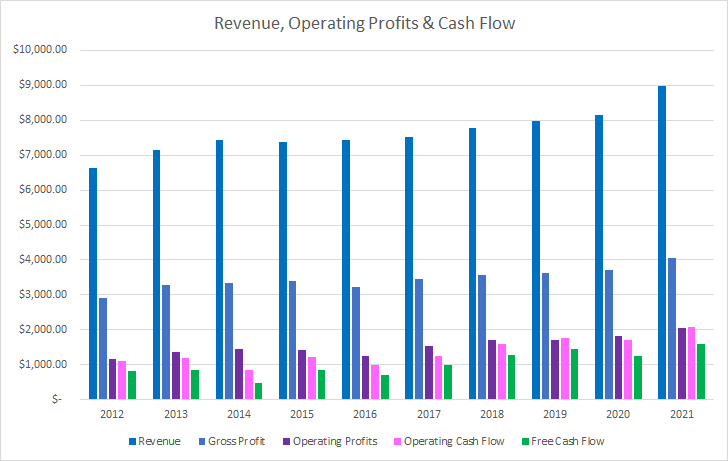
Over the last decade, Hershey’s revenues increased by just 35.0% in total or 3.4% annualized. Gross profits rose 39.8% or 3.8% annualized suggesting that Hershey does have some bargaining power over their suppliers.
Operating profits improved 77.1% or 6.6% annualized with operating cash flow rising 90.3% or 7.4% annualized. Similarly, free cash flow has increased 94.3% over that time or 7.7% annualized. Considering the meager top line growth that’s quite impressive.
The rolling 5-year period CAGRs for Hershey’s revenue, gross and operating profits, and operating and free cash flow can be found in the following chart.
Hershey 5 Year Financial CAGRs (Hershey SEC filings)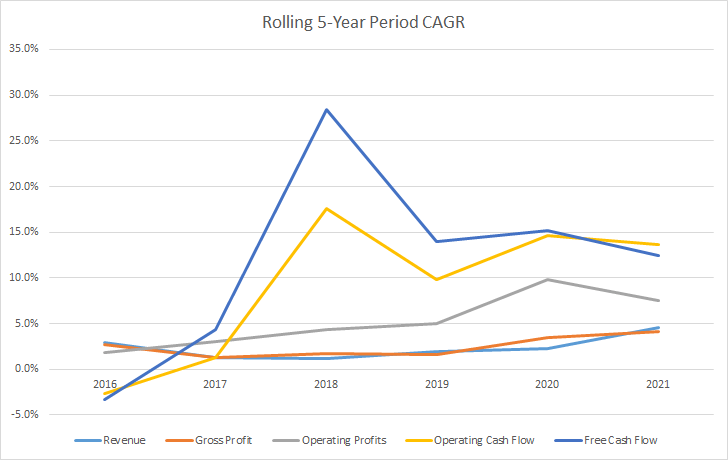
My expectation is that good businesses will be able to show stable or improving margins over time as they are able to press their competitive advantages. With gross profits as well as operating and free cash flow growing faster than revenue over the last decade, it should come as no surprise that Hershey’s margins have been improving.
Hershey Margins (Hershey SEC filings)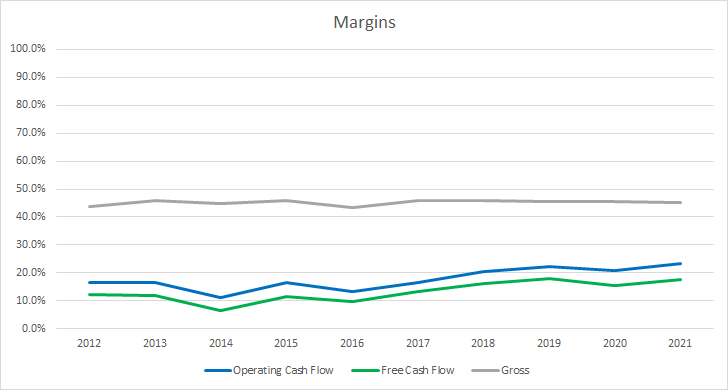
The 10-year average gross margin for Hershey is 45.2% with the 5-year average at 45.5%. Meanwhile Hershey’s average free cash flow margins are 13.2% and 16.1%, respectively.
My preferred profitability metric is the free cash flow return on invested capital, FCF ROIC. The FCF ROIC lets you know how well the business is able to generate cash compared to the capital invested in the business. Once again I expect to see stable FCF ROICs over time that are preferably greater than 10%.
Hershey Free Cash Flow Returns (Hershey SEC filings)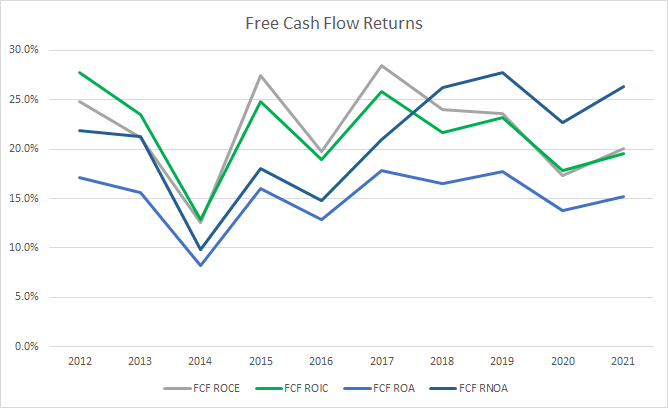
Hershey’s FCF ROICs have varied quite a bit over the last decade; however, every year has been well over 10% with the lowest coming in FY 2014 at 12.9%. The 10-year and 5-year average FCF ROIC for Hershey is an impressive 21.6%.
To understand how Hershey uses its free cash flow I calculate three variations of the metric, defined below:
- Free Cash Flow, FCF: Operating cash flow less capital expenditures
- Free Cash Flow after Dividend, FCFaD: FCF less total cash dividend payments
- Free Cash Flow after Dividend and Buybacks, FCFaDB: FCFaD less net cash spent on share repurchases
Hershey Free Cash Flows (Hershey SEC filings)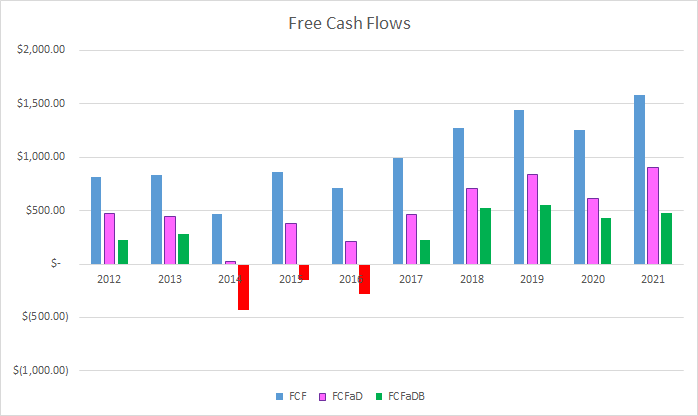
During the last decade, Hershey has generated a total of $10.2 B in FCF. Not bad for a company trading around a $13 B market cap 10 years ago. With that FCF Hershey has paid out $5.2 B to shareholders in dividends which puts the cumulative FCFaD at $5.1 B. Hershey also spent a net $3.2 B on share repurchases over that time which places the cumulative FCFaDB at $3.7 B.
Share buybacks can be an excellent way for businesses to return excess cash to shareholders without being held to the fire as much should buybacks be paused or reduced compared to if the dividend gets cut.
Hershey Shares Outstanding (Hershey SEC filings)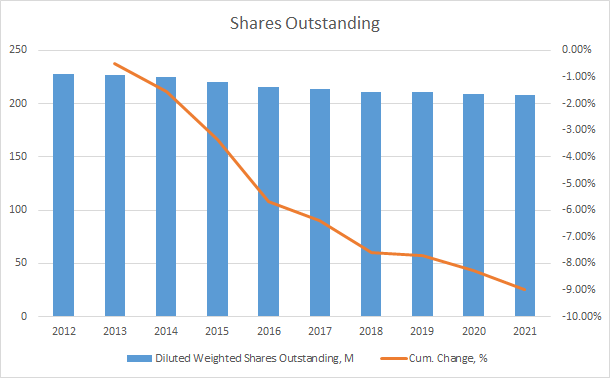
Over the last decade, Hershey has reduced its share count by a pretty meager 9.0% which works out to a 1.0% annual reduction.
As an investor that looks to partner with a business for periods spanning years and potentially decades, I want to make sure the balance sheet is not over-leveraged. While my preference would be for the company to carry no debt, I also realize that most companies, especially those that have stable operations can afford to lever up.
One of the metrics I track is the debt to capitalization ratio. What I want to see is stable or declining levels of debt in the capital structure with significant changes being examined closely.
HSY Debt to Capitalization (Hershey SEC filings)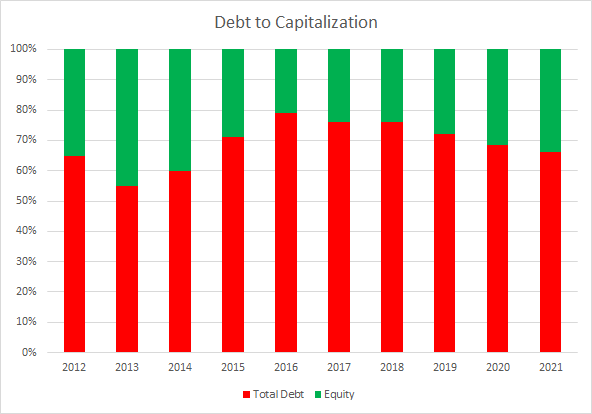
Hershey’s debt-to-capitalization ratio is relatively high, but considering the stable nature of the business, with just one year during the last decade showing a year over year decline in revenues, they can safely run higher debt loads. The 10-year average debt-to-capitalization ratio for Hershey is 69% with the 5-year average at 72%.
The other leverage metrics that I track are the net debt ratios which look at the net debt levels in relation to a handful of income and cash flow metrics. In essence it lets you know how quickly the business could de-lever, assuming no significant impairment to the business, should the interest rate environment change which it appears we’re currently in.
Hershey Debt Ratios (Hershey SEC filings)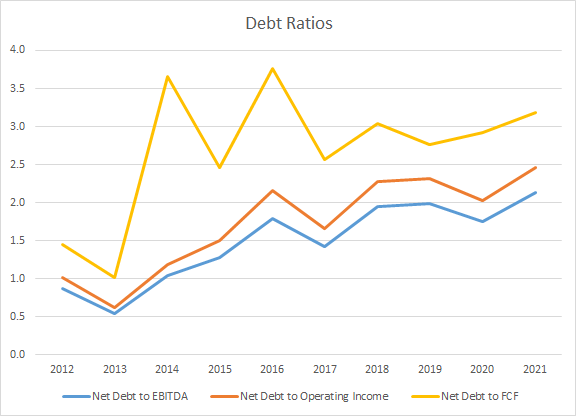
While Hershey’s debt-to-capitalization ratios have been fairly stable over the last decade, their net debt ratios have been steadily climbing. Hershey’s 10-year average net debt-to-EBITDA, net debt-to-operating income, and net debt-to-FCF ratios are 1.5x, 1.7x, and 2.7x, respectively. Additionally the 5-year averages of 1.9x, 2.2, and 2.9x.
Valuation
When valuing a business I like to analyze the valuation from different perspectives and using different valuation methods. The methods that I use are the minimum acceptable rate of return, MARR, analysis, dividend yield theory, the dividend discount model, and a reverse discounted cash flow analysis.
A MARR analysis has you estimate the future earnings and dividends that a business will produce over a period of time. You then find a reasonable expected multiple on those future earnings to determine a future share price. If the expected return is greater than your minimum for investment then you can feel free to invest.
Analysts expect Hershey to have FY 2022 EPS of $7.95 and FY 2023 EPS of $8.50. They also expect Hershey to be able to grow EPS 8.9% annually over the following 5 years. I then assumed that EPS growth would slow to 5.0% annually for the following 5 years. Dividends are assumed to target a 47.5% payout ratio.
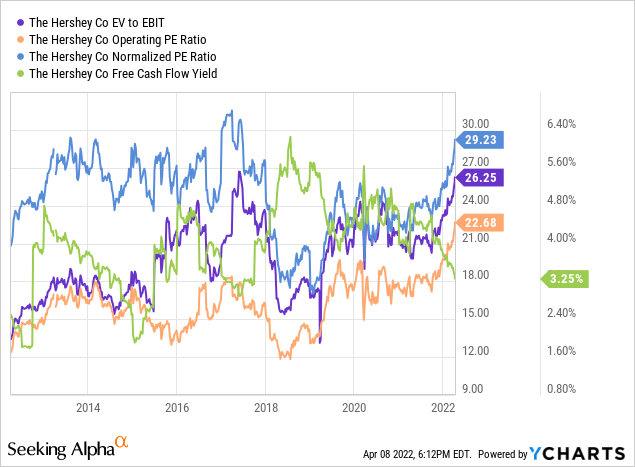
To figure out the expected terminal multiple I like to see how investors have historically valued Hershey. Over the last decade Hershey has typically been valued between 17x and 30x TTM EPS.
The following table shows the potential internal rates of return that an investment in Hershey could generate provided you believe the assumptions laid out above are reasonable estimates for the future. Returns assume that dividends are paid in cash and follow Hershey’s historic payment and increase timelines.
| IRR | ||
| P/E Level | 5 Year | 10 Year |
| 30 | 11.4% | 9.0% |
| 25 | 7.3% | 7.1% |
| 22.5 | 5.0% | 6.1% |
| 20 | 2.6% | 4.9% |
| 17.5 | -0.1% | 3.7% |
| 15 | -3.2% | 2.2% |
Source: Author
Additionally I use the MARR analysis framework to reverse the process and determine what price I could pay today in order to generate the returns that I desire from my investments. My base hurdle rate is a 10% IRR and for Hershey I’ll also examine 8% and 9% return targets.
| Purchase Price Targets | ||||||
| 10% Return Target | 9% Return Target | 8% Return Target | ||||
| P/E Level | 5 Year | 10 Year | 5 Year | 10 Year | 5 Year | 10 Year |
| 30 | $239 | $208 | $249 | $226 | $260 | $245 |
| 25 | $202 | $179 | $210 | $194 | $219 | $210 |
| 22.5 | $184 | $164 | $191 | $178 | $199 | $193 |
| 20 | $165 | $150 | $172 | $162 | $179 | $175 |
| 17.5 | $146 | $135 | $152 | $146 | $159 | $157 |
| 15 | $128 | $120 | $133 | $130 | $138 | $140 |
Source: Author
Dividend yield theory is a valuation method centered around reversion to the mean under the assumption that investors will typically value a business around a normal dividend yield. For Hershey I’ll use the 3-year average forward dividend yield as a proxy for the fair value of Hershey.
Hershey Dividend Yield Theory (Hershey Investor Relations and Yahoo Finance)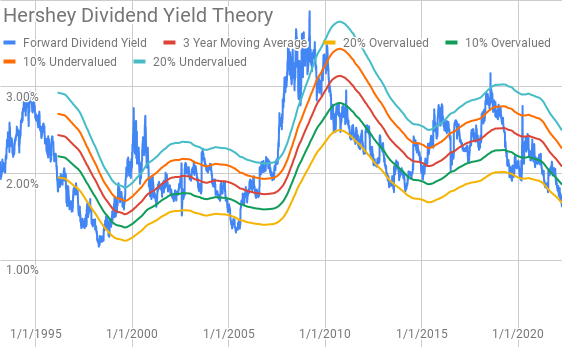
Hershey currently offers a forward dividend yield of 1.61% compared to the 3-year average of 2.08%.
The dividend discount model is a valuation model that uses the current annual dividend, your required rate of return, and an estimate for the long term sustainable dividend growth rate.
Hershey Dividend Discount Model (Hershey Investor Relations and Yahoo Finance)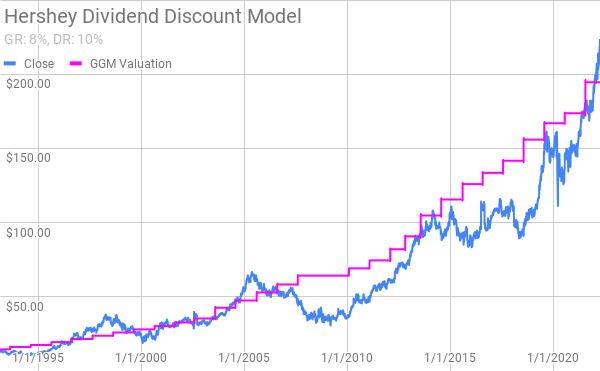
Based on Hershey’s current annual dividend of $3.604 per share, a 10% required return, and an estimated 8% dividend growth rate shares of Hershey are would around $195 per share. At a 7% dividend growth rate Hershey shares are worth around $129 per share.
The reverse discounted cash flow analysis can be used to untangle what the current market valuation implies about the future growth and margin structure required for a business in order to generate the necessary cash flows. I use a simplified model based on revenue growth, a terminal growth rate of 3.5%, an initial free cash flow margin of 17% that increases to 20% over the forecast period.
Under those assumptions, Hershey needs to grow revenues 11.9% annually in order to generate the free cash flows to support a 10% return. Lowering the required return to 8% reduces the necessary revenue growth rate to 6.6% annually. Using the revenue growth for the 8% scenario of 6.6% but raising the required return up to 10% requires free cash flow margins to expand to 32% during the forecast period.
Conclusion
Hershey is one of those great American brands that has thrived over the years. Their strong brand allows them to carry strong free cash flow margins routinely in the mid-teens. While Hershey’s FCF ROICs fluctuate quite a bit, they are quite steady over time around the 20% level.
Dividend yield theory suggests a fair value range between $157 and $193 while the dividend discount model puts the fair value around $195 per share.
The MARR analysis with a 10% required return 5 years out suggests a fair value range between $165 and $202 assuming a 20x to 25x terminal multiple. Reducing the MARR to 8% increases the fair value range to $179 to $219.
The reverse DCF appears to show that 10% returns aren’t likely from current valuations as the required revenue growth is quite aggressive at 11.9% annually. Even 8% returns require a significant increase in revenue growth to 6.6% annually over the next decade compared to the 3.4% mark hit from 2012 through 2021.
The only really disappointing thing about Hershey is the lackluster growth in revenues. However, while that’s a bit of a concern I didn’t buy Hershey for explosive growth. It was purchased for its ability to be a portfolio stabilizer that can consistently grow over time.
In the face of revenues growing just 3.4% annually over the last decade Hershey has managed impressive growth further down the financial statements with operating profits growing 6.6%, operating cash flow rising 7.4%, net income climbing 9.4% and free cash flow growing 7.7% annually over that same time.
Those kind of results lend credence to Hershey’s target of 2-4% long term revenue growth rates leading to 6-8% EPS growth. If Hershey is able to meet those targets they’ll continue to be a stealthy compounder that you look back in 10 or 20 years and are amazed at how they’ve done.
Hershey’s share price has had an incredible run of late climbing over 15% YTD compared to the nearly 6% decline for the S&P 500.
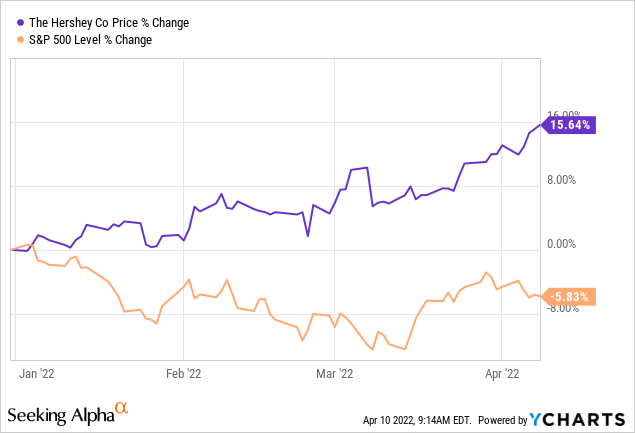
That’s a testament to the defensive nature of the business that isn’t likely to see much variance in demand.
Hershey isn’t cheap at current levels; however, the valuation also doesn’t appear to be that egregious if Hershey is able to hit their targets. I’m not going to buy at current levels, but given the quality of the business Hershey is still a strong hold even at the somewhat elevated levels.
Be the first to comment