

Carlos Alvarez
Thesis
Peter Lynch probably is best known for identifying 10 baggers – catching fast growers when they were still at a relatively small scale. However, in his writings (One Up on Wall Street and Beating the Street), he suggested categorizing stocks into a total of 6 styles, and fast growers are only 1 of them. He then provided guidelines for individual investors for identifying each type, showed how each type can be a profitable investment, and believed that individual investors actually have an advantage over large money managers if these guidelines are followed.
And this brings me to the main topic for today, Google (NASDAQ:GOOG) or Alphabet Inc. (NASDAQ:GOOGL). The thesis is quite simple. I will explain why GOOG fits perfectly into the stalwart category that Lynch described under current conditions. As detailed in his writings, these stalwarts, if purchased at a good price, can be expected to deliver returns too. Plus, these stalwart stocks can also offer downside protection during market recessions.
In the remainder of this article, I will go over the following guidelines and criteria that Lynch uses to pick stocks in the stalwart category at a good price. And hopefully, you will agree that GOOG fits all of them nicely under current conditions:
- A stalwart status. Companies in the stalwart category are large and dominant players in their business segment, but are still able to grow. Lynch prefers to see annual growth rates in the upper single digits or above.
- Valuation. Most people are familiar with the Lynch PEG ratio (P/E ratio divided by earnings growth rate). Lynch prefers a PEG around 1x or below.
- Share buybacks. This is an area that most investors do not pay enough attention to. However, share repurchases are very important and also reflective of a company’s financial health and management style, especially for large stalwarts. Lynch prefers to see stocks with consistent share buybacks, which illustrates the business generates extra cash flow and also management is confident in their existing business (so that they chose to repurchase their own shares rather than, say, acquire another business).
- And finally, inventories. Just like share buybacks, this is another place that investors can easily check (and should) but often do not. Inventory data are one of the financials that are the least subject to interpretation (just like buybacks) and is very indicative of the health of a business.
1. Stalwart status
There is little need to justify GOOG’s stalwart status. Google search simply dominates the worldwide market of search engines, as seen in the chart below. It has been consistently maintaining a lopsided market share (and the market share is more than 83 percent as of June 2022). In contrast, the 2nd and 3rd largest players, Bing and Yahoo!, accounted for only about 9% and 2.5% of the global search market. Built on the strength of search engines, the company has also expanded its services and enjoy a leading position in many other segments vital to the digital economy, such as a digital ad, cloud services, email, productivity tools, enterprise products, and mobile devices.
And next, we will see that GOOG has been maintaining, and is also very likely to keep maintaining, robust annual earnings growth rates in the double digits that Lynch prefers to see.
Source: www.statista.com data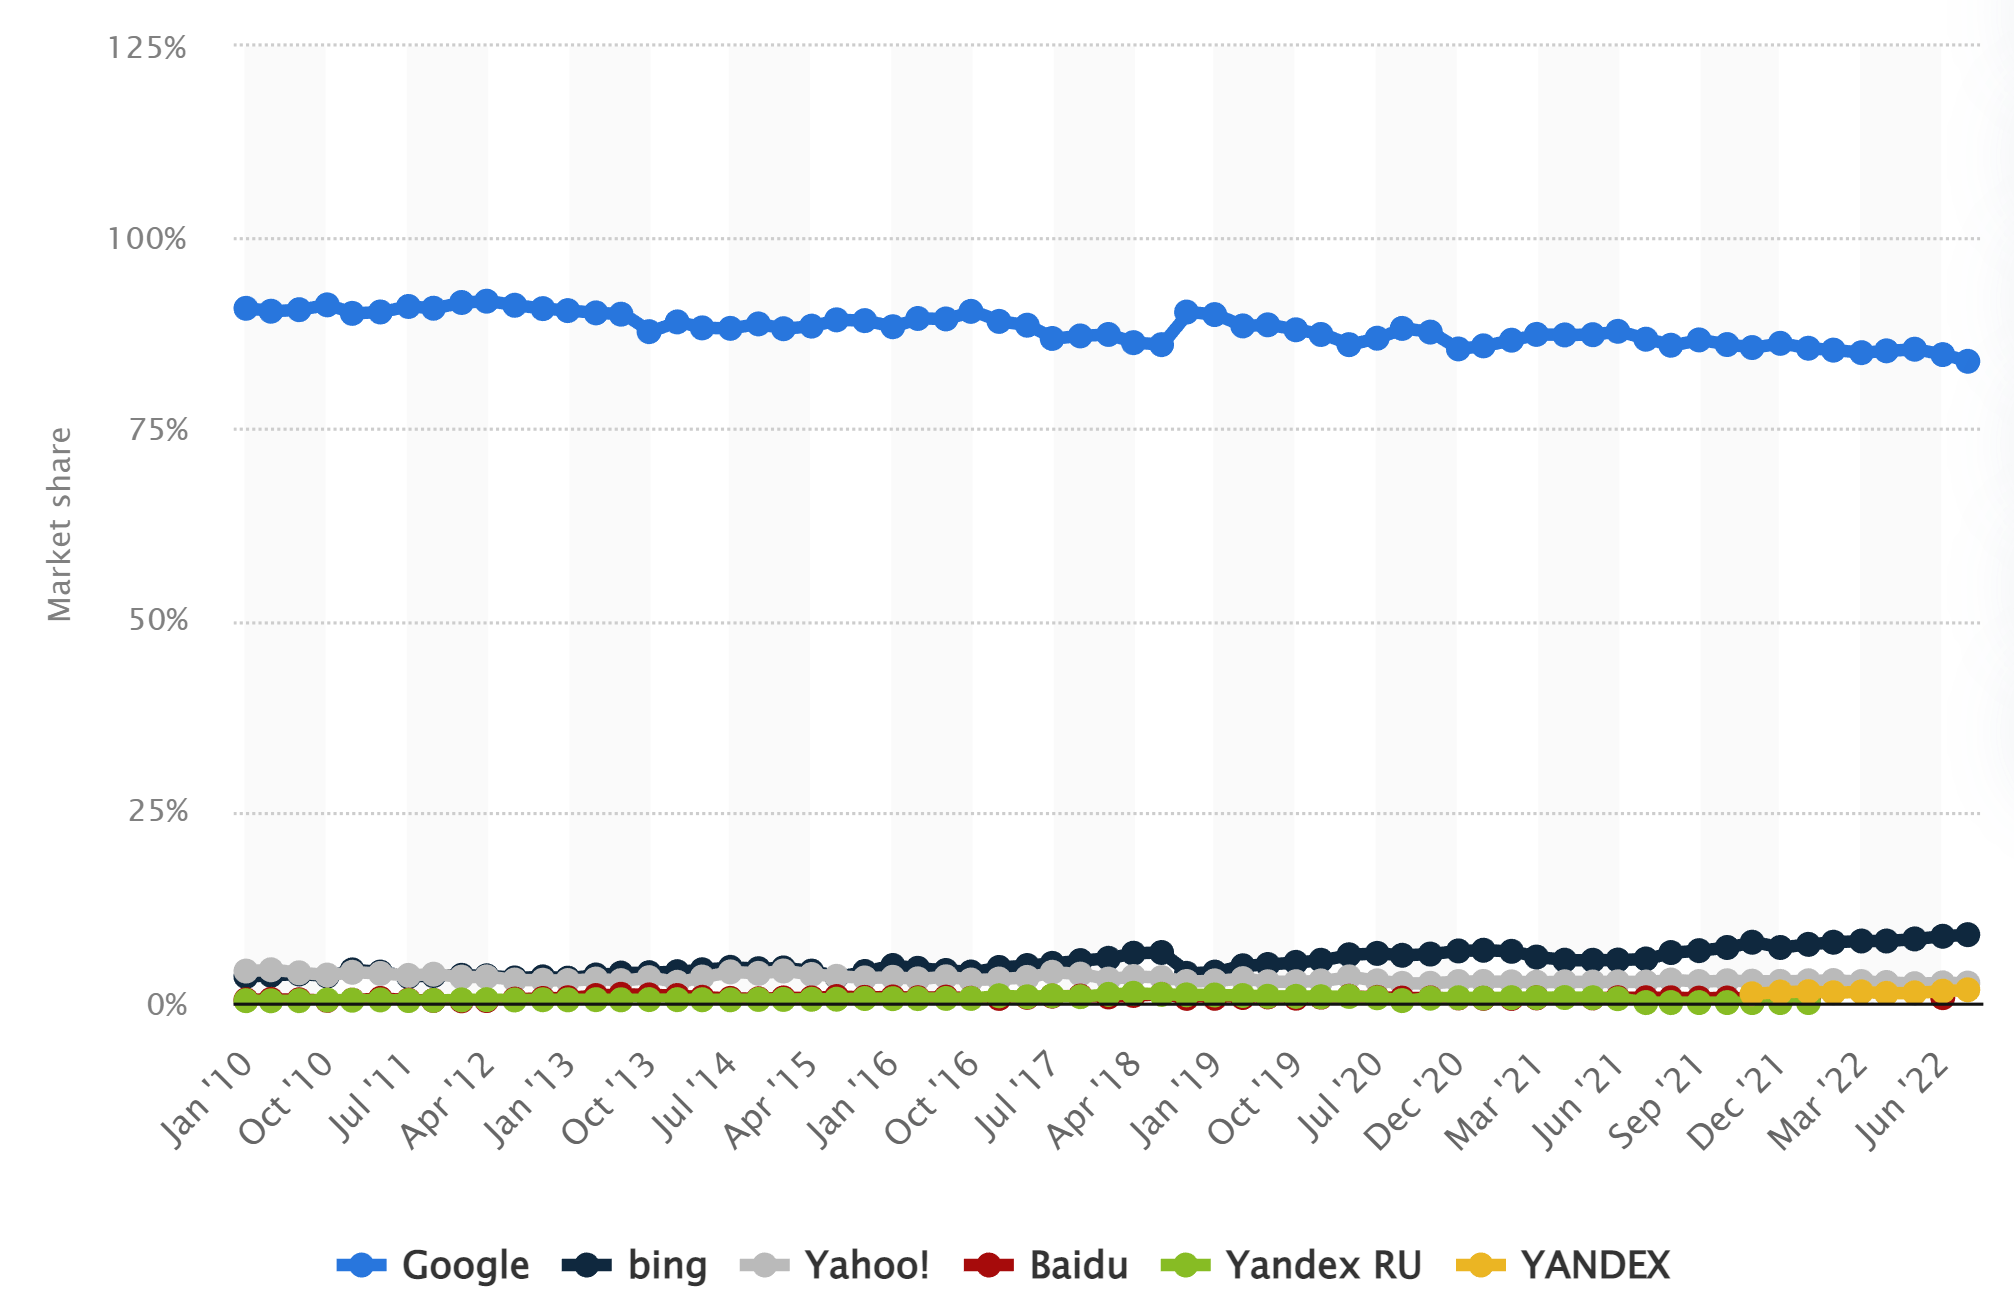
2. Growth and PEG multiples
The FWD PE ratio for GOOG is currently 18.2x as of this writing according to Seeking Alpha data. And its EPS has been growing at a rate of 19.5% in the past 10 years and 25.5% in the past 5 years, translating into a PEG ratio of 0.93 and 0.71, respectively. And as aforementioned, these PEG ratios are far below the 1x PEG that Lynch prefers to see. Looking ahead, the consensus estimates project its EPS to grow from $4.77 in 2022 to $9.49 five years later, translating into an annual growth rate of 14.7%. If we calculate our PEG ratio based on this projected growth rate, it is 1.23x, higher than 1x but not by that much. Finally, bear in mind that Google maintains a sizable net cash position. Therefore, its PE ratio is lower once its cash position is adjusted (about 17.8x only). And consequently, its PEG ratio is also lower correspondingly as shown in the last column of the following table.
Source: Author based on Seeking Alpha data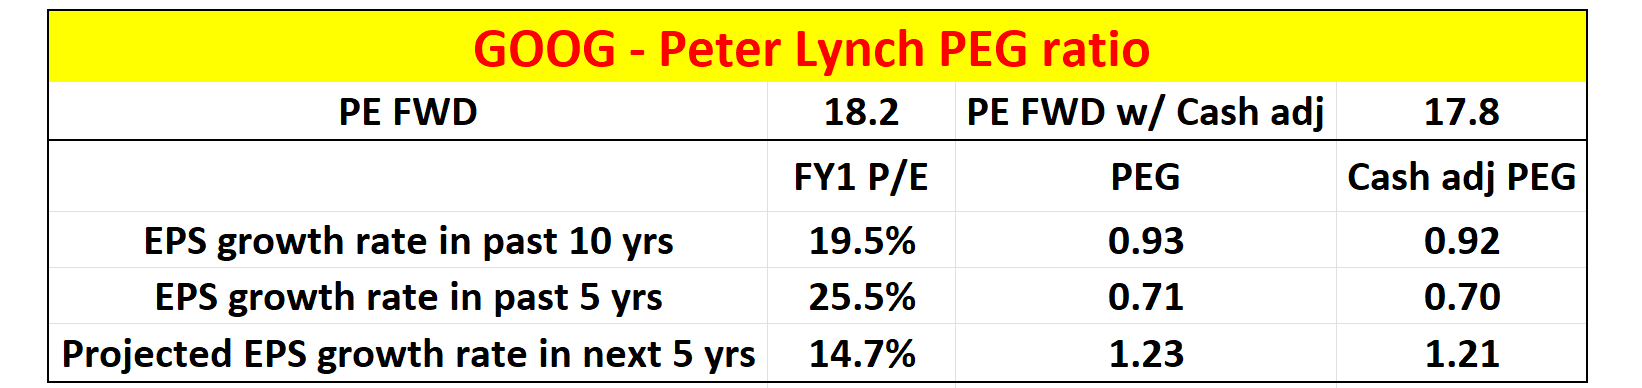
3. Share buybacks
GOOG has started buying back its own shares since 2015 as seen from the plot below, and the buybacks have been consistently expanding. To wit, GOOG bought $15.39B of its own shares in the last quarter alone. And on average, it spent a whopping $5.2B per quarter buying back its shares since 2016. In terms of the buyback yield, the yield is currently at 5.11% as seen in the bottom panel of the chart. And on average, the buyback yield has been 1.35% since 2016. As Lynch mentioned in his books, such large-scale and consistent share repurchases are a strong indicator of GOOG’s financial strength and also management’s confidence in their own business.
And for me, I almost always prefer to see share buybacks rather than cash dividends for several reasons. Share buybacks are often a more tax-efficient way to return capital to shareholders than dividends, both on the corporate end and on my end also. If I want to sell, I can better decide on the timing and the batches of shares to sell to minimize the tax headwinds.
Source: Seeking Alpha data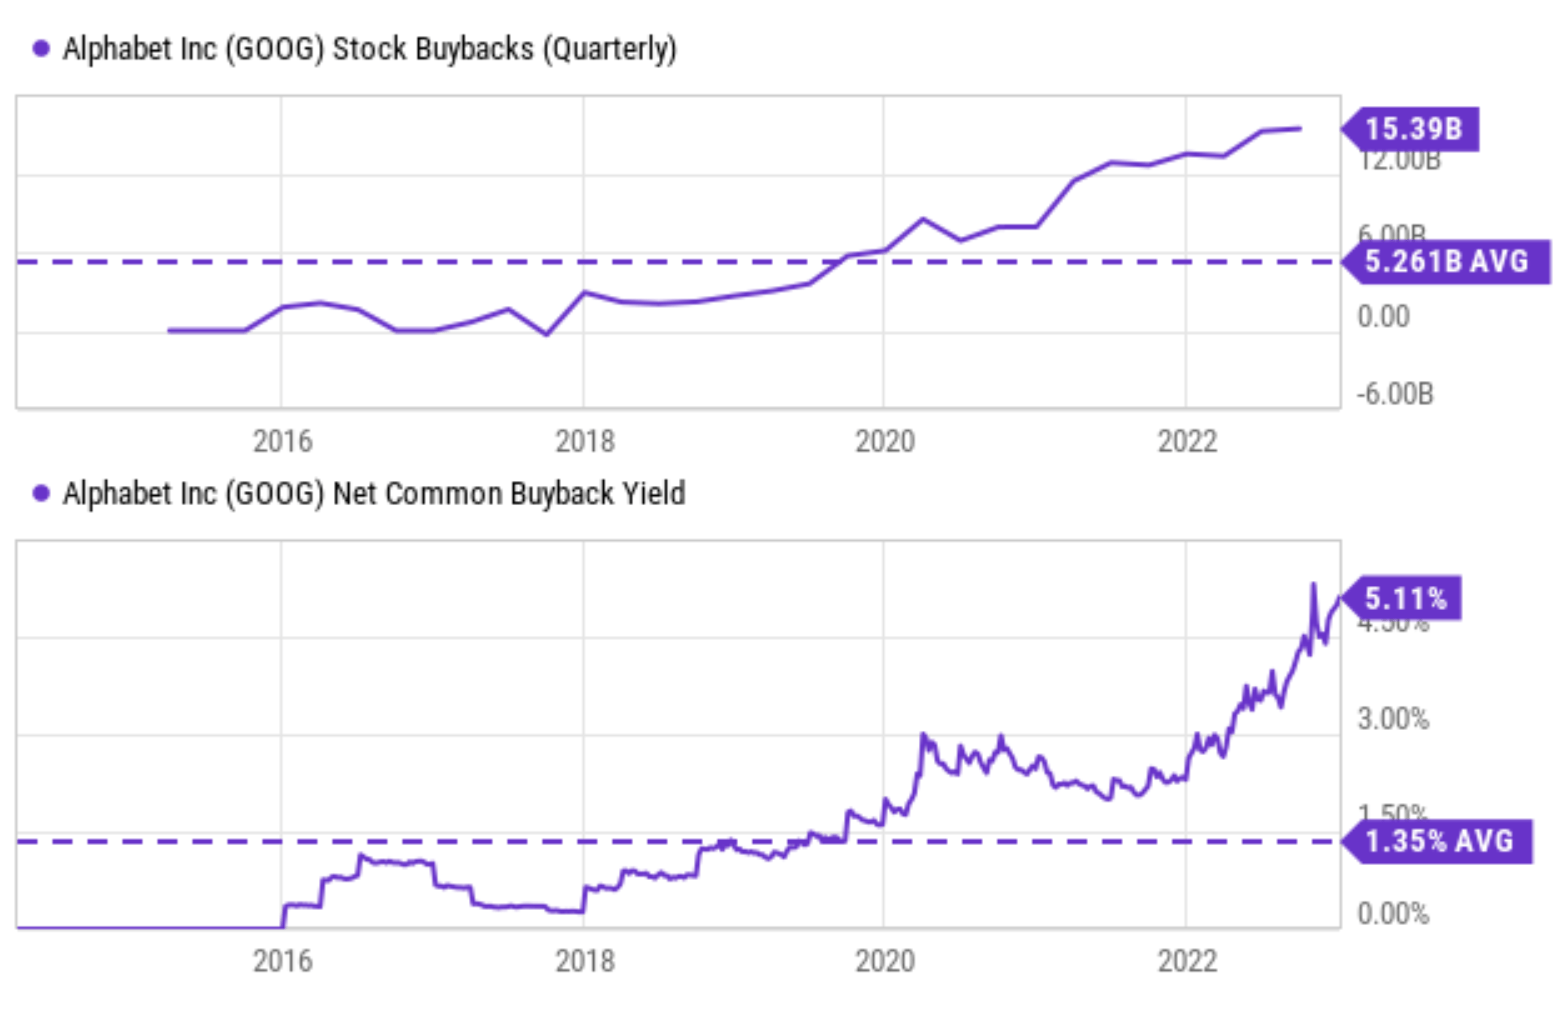
4. inventories
The next chart shows GOOG’s inventory and also its inventory as a percentage of its sales on a quarterly basis. This is the one area that GOOG is showing some worrying signs when judged by Lynch’s guidelines. As seen in the top panel of the chart, GOOG’s inventories have been building up in recent quarters since 2022. And it currently sits at $3.1B, almost 4x higher than its average level of $866M in the long term.
When expressed as a percentage of its sales, as shown in the bottom panel of the chart, its current inventory is about 4.6% of its sales. Its inventory issues are less concerning in this perspective (but still about 2x higher than the long-term average of 2.3% as seen).
Overall, I am not too concerned about its current inventory problems and I see these problems to be only temporary. Historically, it has experienced higher inventory issues, such as in 2013 when its inventories reached 5% of its sales. And a large reason for the current inventory build-up is the global shipping congestion, which is gradually clearing up. And finally, as a software-oriented business, GOOG’s inventory, even at its current level, is not alarming when compared to other businesses. Take Apple as an example, a firm that is best known for its operational efficiency and inventory management. Apple’s current inventory as a percentage of its sales stands at 5.6% (which is also its long-term average).
Source: Seeking Alpha data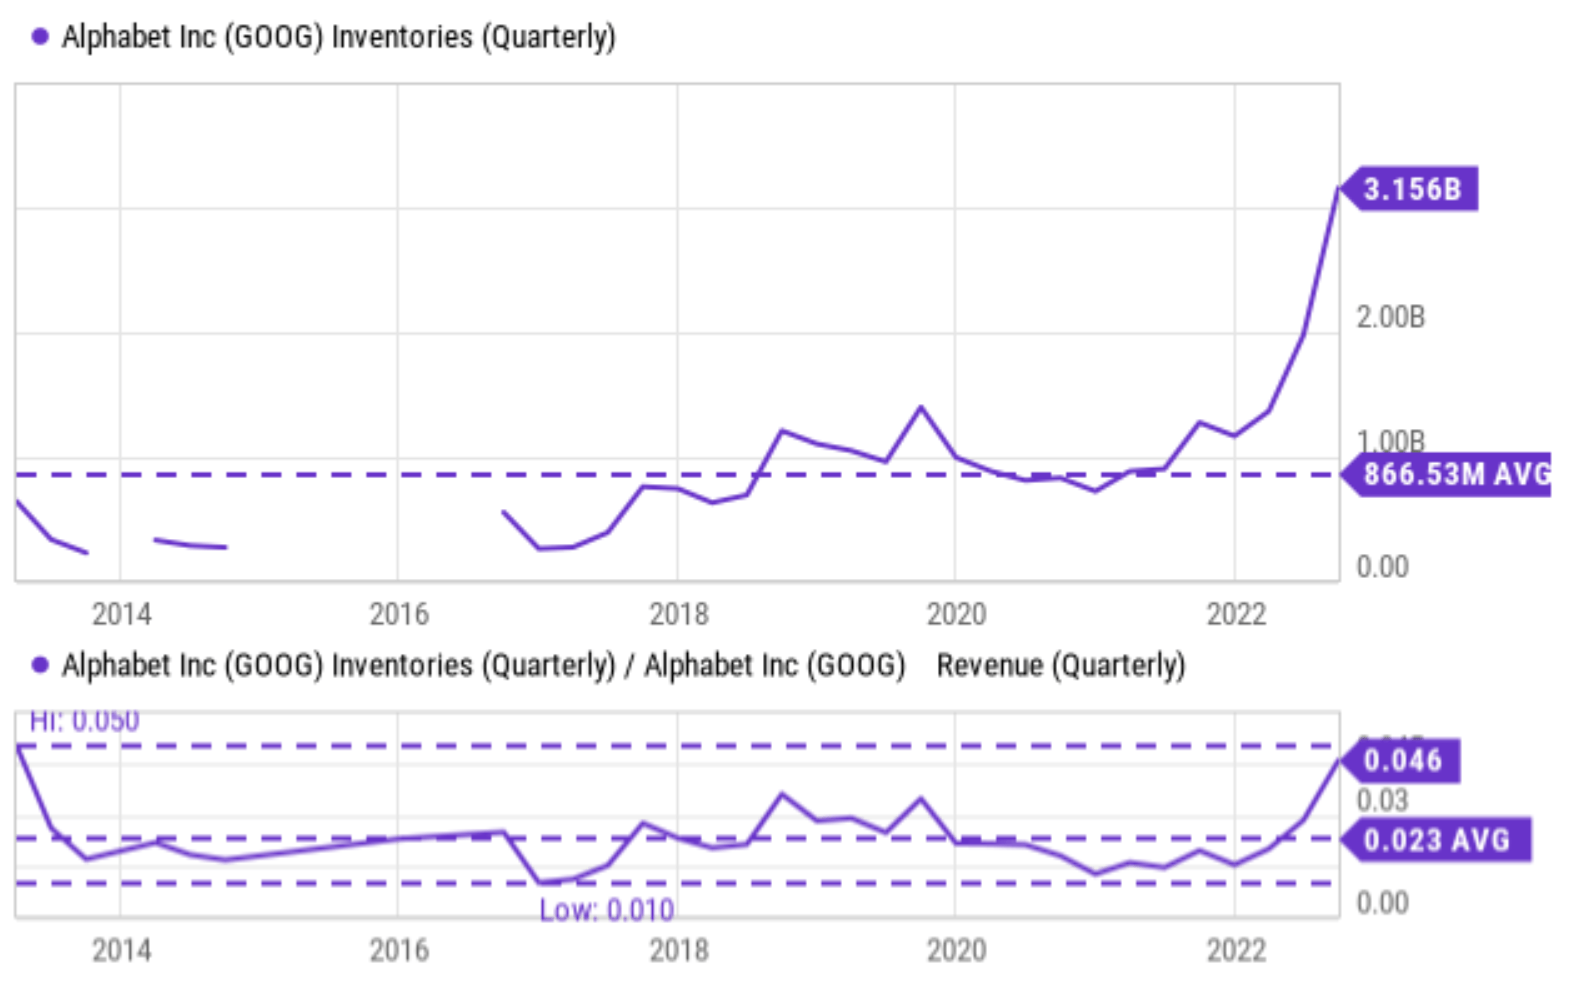
Other risks and final words
I’d like to point out that GOOG faces a few other risks besides the inventory issues just mentioned. Due to the strengthening of the U.S. dollar, foreign exchange had an unfavorable impact on earnings for Google’s overseas income. Furthermore, I have been seeing an overall pullback in advertising spending and lower user engagement in gaming in recent quarters, which could keep pressure on GOOG’s bottom line in the near term. Finally, as mentioned in my earlier articles, GOOG has increased its headcount substantially in the recent 2 or 3 years and is very likely having some overcapacities that need to be managed in the near term.
To conclude, ordinary investors who have not mastered Lynch’s elusive art of catching 10 baggers should not despair. Lynch categorized stocks into a total of 6 styles, and 10 baggers are only 1 of them. If your focus is return instead of excitement, stocks in other categories offer excellent opportunities too and can be identified using more repeatable and proven guidelines. The core thesis of this article is to argue that Google fits perfectly into the stalwart category that Lynch described. Under its current conditions, it offers an excellent returns profile plus downside protection against market recessions with its scale and reach.
Be the first to comment