

Interested in using short sales to your advantage? Keep reading. Gunter_Nezhoda
Shorting a stock occurs when an investor borrows a share from an owner to sell at current prices. That investor will incur some sort of borrowing fee as a result of this until they return the share they borrowed which is called covering.
If the stock price goes up during that time the person short the stock will lose money as they will have to buy back the share at a higher price then what they sold. Alternatively, if the stock price goes down then the short seller generates a profit by being able to buy the share back at a lower price.
The structure of shorting creates an asymmetrical risk. The upside potential for a short position is always limited to 100% representing a stock going all the way to zero. The downside potential for a short position is unlimited as a stock may theoretically appreciate indefinitely. In my eyes, this makes shorting a stock relatively unattractive because I could lose not just 100% of my money, but 1000% of it if my thesis is incorrect. And yet the return potential is always capped.
Shorting can be merged with other tactics though. For example, in merger arbitrage scenarios short positions can be coupled with long positions to squeeze out risk – short the company buying, long the company being acquired. Once one understands the mechanics of shorting, it simply is another lever in an investor’s toolkit to exploit inefficiencies that can be combined with levers of long positions, options trading, and warrants.
Rather than spending time on the basics of shorting, I’d like to look at the regulations around shorting and the potential implications. Particularly I’ll be discussing Regulation SHO, the Threshold List, and how the T+35 Theory gives a window into forced buyers. If you need a refresher on the basics of short selling I’d suggest reading this article.
Regulation SHO, Naked Short Selling, and the DTCC
Regulation SHO is a regulatory measure developed by the Securities and Exchange Commission (SEC) to manage short selling. It went into effect in 2005 particularly to target the practice of so-called “naked” short selling given growing pressure and evidence that the practice was widespread in the market.
Naked short selling happens when someone shorts shares that have not been confirmed to exist. This is contrasted with normal short selling where the share is borrowed first and then sold. When naked short selling happens at scale it creates a large volume of shares that literally do not exist – phantom shares. When short sellers are required to close their positions they may not be able to as a result of the shares not actually being there to buy and something called a failure to deliver – FTD – occurs. It’s basically the securities equivalent of an IOU representing that these short sellers are required to buy shares within a certain period of time after that FTD to cover their position.
To be clear, naked short selling is illegal. It’s perhaps instructive to think about why it’s illegal. Consider that if naked short selling is allowed it means that someone could take say a company with ten million shares outstanding and theoretically short all ten million of those shares and even more of them without borrowing them from anyone. The pricing action that can be caused by shorting can influence the stock price toward a downward trend with no connection to fundamentals. Negative momentum in the stock can literally destroy a company’s market capitalization in extreme cases.
While this may not seem feasible for stocks that have large market capitalizations, there are plenty of small companies below $100m market cap that deep pocketed interests could short out of existence through this approach. The result would be that those interests could generate $100m in profit.
Regulation SHO was put into place to help crack-down on the issue of naked shorting in the market and particularly aiming to reduce FTD overall. There’s some benefit to the system as it was designed in that it allows for clerical or administrative errors a couple of days to actually settle.
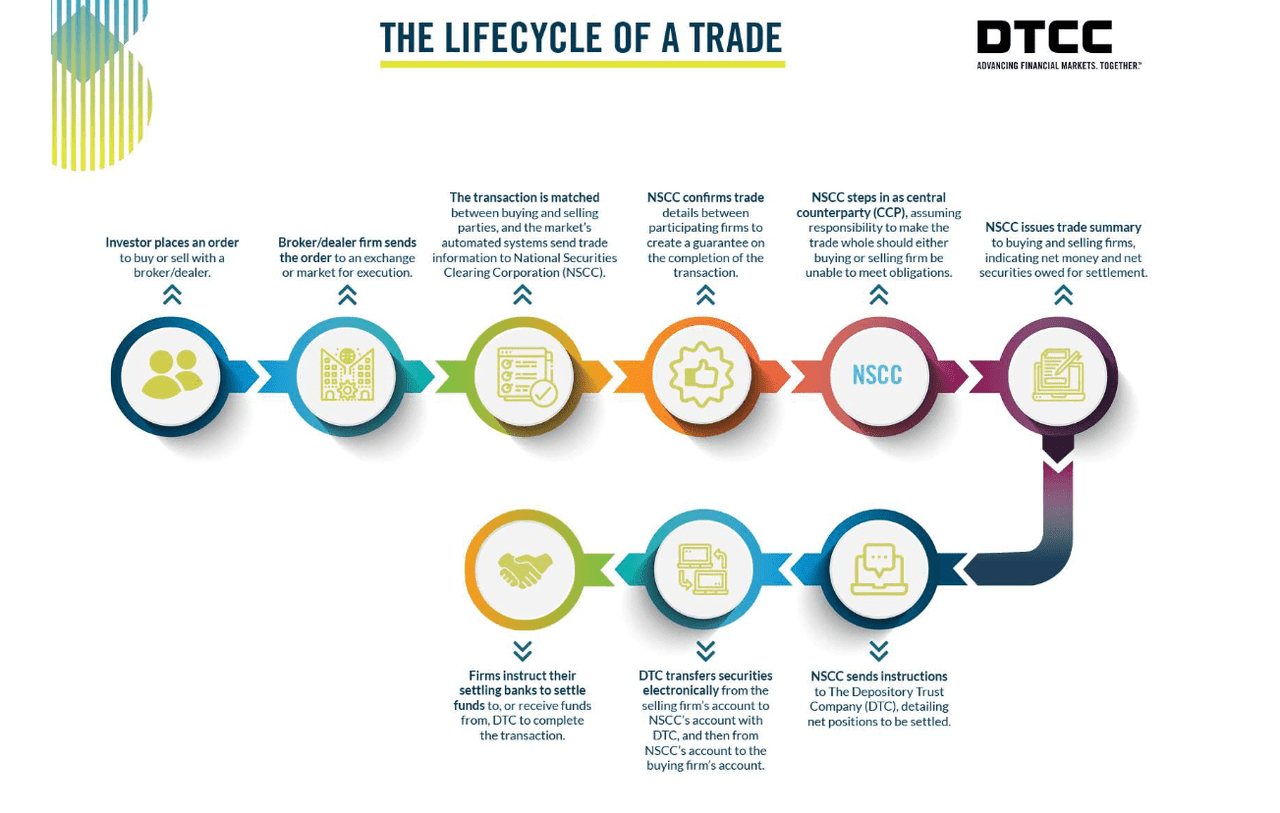
Settlement on US stock exchanges is managed electronically through the Depositary Trust and Clearing Corporation, a private company formed in 1999. One academic report highlights:
Ownership records are largely held, tracked, and transferred electronically through the DTCC, with more than 99.9% of all trades involving only electronically held securities (Morris and Goldstein, 2009). The DTCC becomes the central counterparty of all duly-matched error-reconciled trades, and electronically checks and updates relevant stock ownership accounts.
Essentially, DTCC keeps the books on the entire US stock market. This privately held for-profit company virtually controls the market of accounting for share ownership across all US publicly-listed companies. They process trillions of dollars of volume every single day through a complex proprietary process and includes business lines considered as Systemically Important Financial Market Utilities (SIFMU) by the US government.
DTCC Website DTCC Website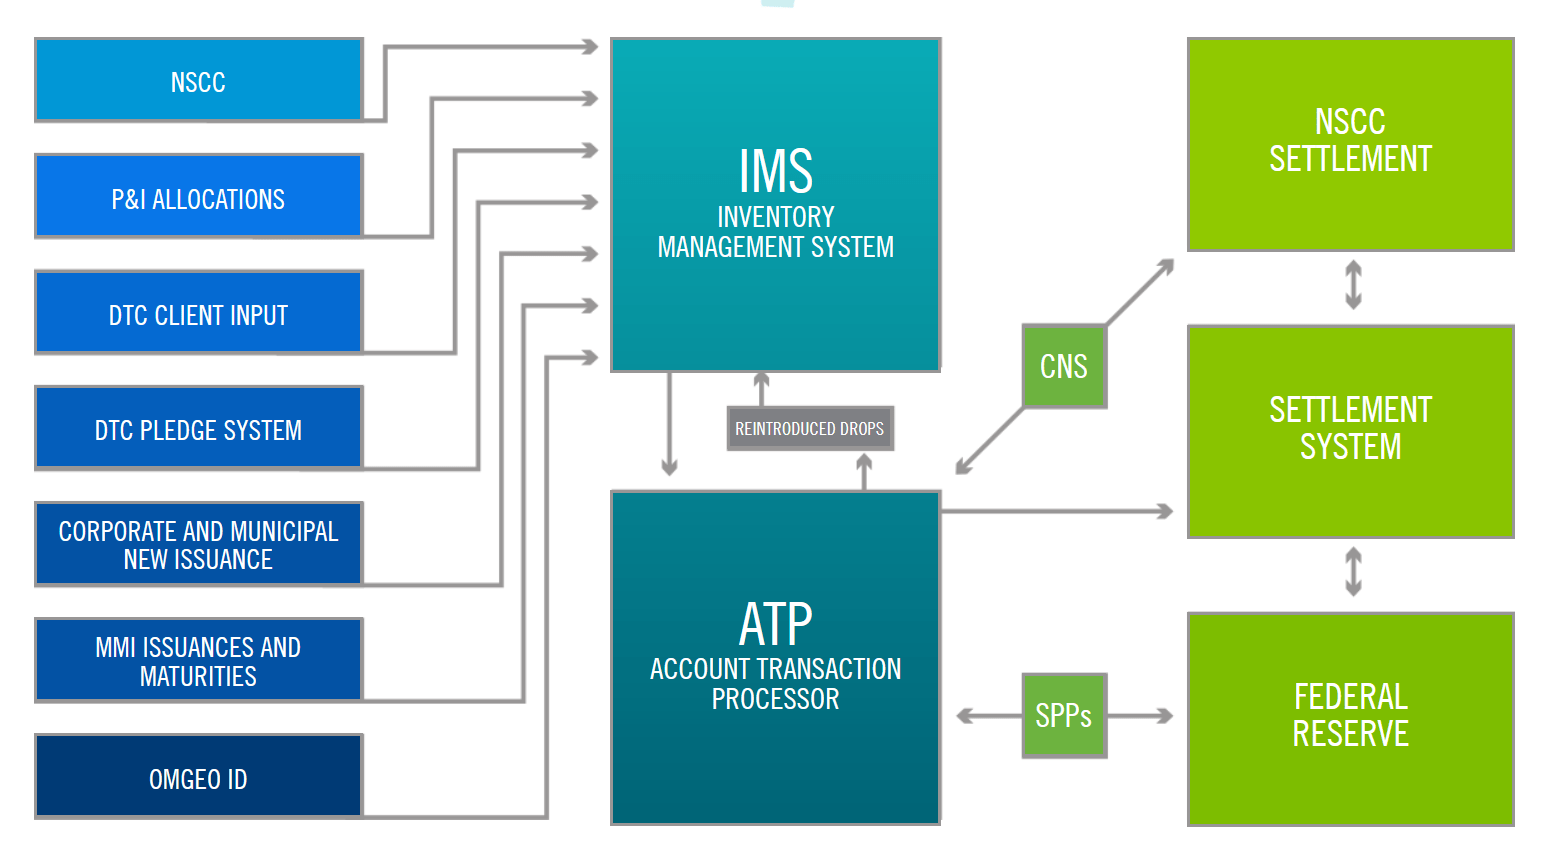
What this means is that when a failure to deliver occurs and shares are unaccounted for the DTCC’s accounting practices are implicated as well. One might think that with a 99.9% control of the market that the company is effective at mitigating FTDs and accounting for shares. On the contrary, according to data from the above-mentioned report 95% of NYSE listed shares were affected by FTDs over a three year period in 2005-2008.
This may not simply be the result of the DTCC though as that markets have been changing. With the rise of exchange traded funds (ETFs) which trade algorithmically we’ve seen that they account for an outsized percentage of FTDs in today’s markets. Consider this passage from this 2018 report:
While Figure 2 shows that these rule changes led to a dramatic decline in both stock and ETF FTDs in early 2009 and a relatively low level and negligible growth of stock-related FTDs during 2010-2016, there is an upward trend in the dollar volume of ETF FTDs over the past seven years. At the end of 2016, ETF FTDs accounted for over 78% of all equity-related FTDs.
“Naked” short selling can be revealed when a short seller fails to deliver up the borrowed shares within a standard settlement period. An analogy here is it’s kind of like defaulting on a loan. When enough defaults happen as evidenced through FTDs with a particular stock, Regulation SHO rules come into play and the stock can be placed on what’s called the Threshold List. Here’s how NASDAQ describes it on their Threshold List page:
As defined in Rule 203(C)(6) of Regulation SHO, a “threshold security” is any equity security of any issuer that is registered under Section 12 of the Exchange Act, or that is required to file reports under Section 15(D) of the Exchange Act (commonly referred to as reporting securities), where, for five consecutive settlement days:
There are aggregate fails to deliver at a registered clearing agency of 10,000 shares or more per security;
The level of fails is equal to at least one-half of one percent of the issuer’s total shares outstanding; and
The security is included on a list published by a self-regulatory organization – SRO.
A security ceases to be a threshold security if it does not exceed the specified level of fails for five consecutive settlement days.
So whenever a stock is shorted so much that shares fail to be returned they’re essentially placed on a watchlist. They remain on that list until the original shares which failed to be delivered are reconciled. If the FTDs remain outstanding for 35 consecutive trading periods then shorts are forced to close their positions due to Regulation SHO.
Cornell Law School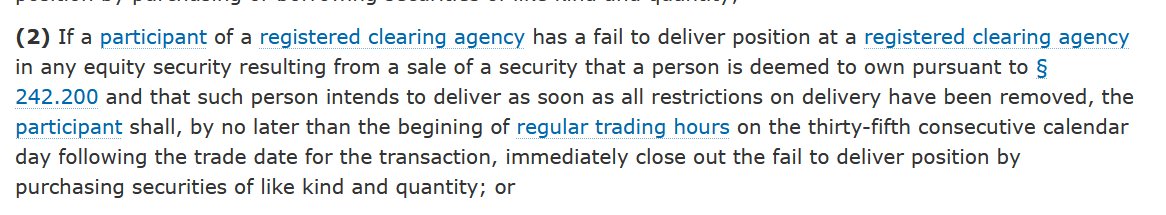
These mechanics allow for balance to be restored whenever there’s an abundance of short selling that is not reconciled with the amount of shares that exist. Although that balance can have a theoretical time lag of 35 trading days to reconcile.
Forced Buyers: The T+35 Theory
Forced selling is a concept that I first encountered reading Seth Klarman’s Margin of Safety. It relates to situations where owners of a stock are forced to sell for some reason or another. This could be due to a margin call, deletion from an index, or delisting concerns. For example, when a stock is removed from the S&P 500 index, ETFs that seek to mimic that index similarly will need to adjust their holdings. They are “forced” to sell as a result of this change despite any direct relation to company fundamentals.
We can understand the concept of forced buyers if we flip this scenario around. Whenever a stock is removed from an index another one is typically added, so in this example above another stock would be added to the S&P 500. Any ETF looking to mimic that index will now also be forced buyers in the company being added.
Forced buyers and forced sellers can represent opportunities in the market for investors who understand the underlying dynamics forcing trading. From what we covered above we can see how Regulation SHO can create forced buyers by forcing shorts to cover their position. We can use failures to deliver as an indicator given once they occur the short seller has thirty five days to buy the shares back before it automatically happens.
This is essentially the T+35 Theory – that you can use the FTD indicators, add 35 trading days, and have a window into when short sellers are forced buyers. In some cases these FTD instances alone can generate a short squeeze if the volume and float is low. Let’s look at some examples though to better contextualize
High Failures to Deliver: AMZN, SPY, SPIB, YLD
Here are a few examples of stocks with high amounts of FTD given data from Stocksera. A piece of context is that the SEC publishes FTD data twice a month. Failures to deliver in the first half of the month are reported at the end of the month and the second half is reported the following month on the fifteenth. The data we will be looking at is from the first half of August.
First up is Amazon (AMZN).
Stocksera Stocksera
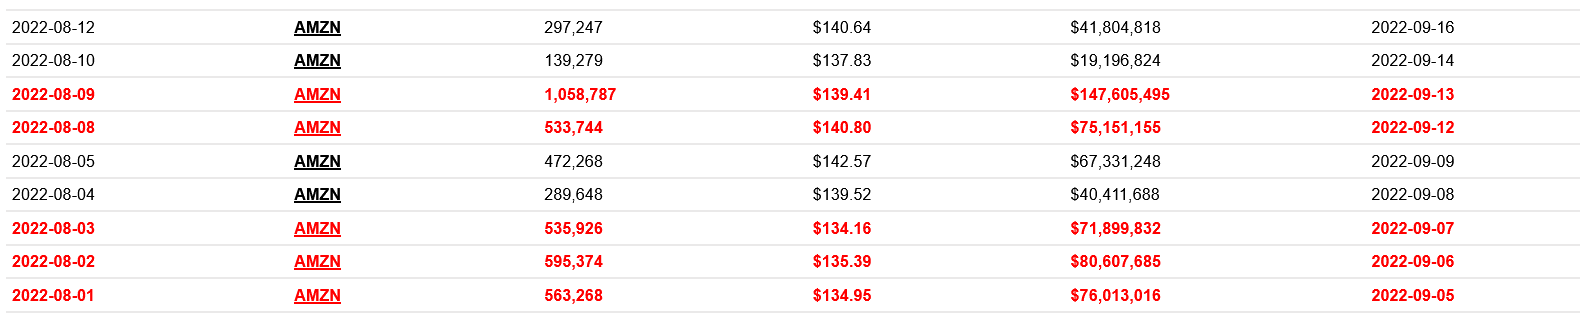
What this data shows is that between now and Sept. 16 there are a number of FTDs that must be closed out if they haven’t already. We can do the math and it totals to 4.486m shares that have to be bought due to FTDs in the beginning of August. To understand the potential impact on the stock price we can look at volume data. Average 10-day volume for AMZN is 47.7m shares meaning these FTDs are unlikely to cause much change in the stock price. Shorts should be able to cover amidst normal trading.
Stocks like Amazon which have high volume and liquidity are typically less impacted by FTDs unless they happen at a massive scale. AMZN stock has a float of 9.2b shares which makes the 4m that need to be covered a drop in the proverbial bucket.
Let’s turn to the S&P 500 ETF SPY next (SPY).
Stocksera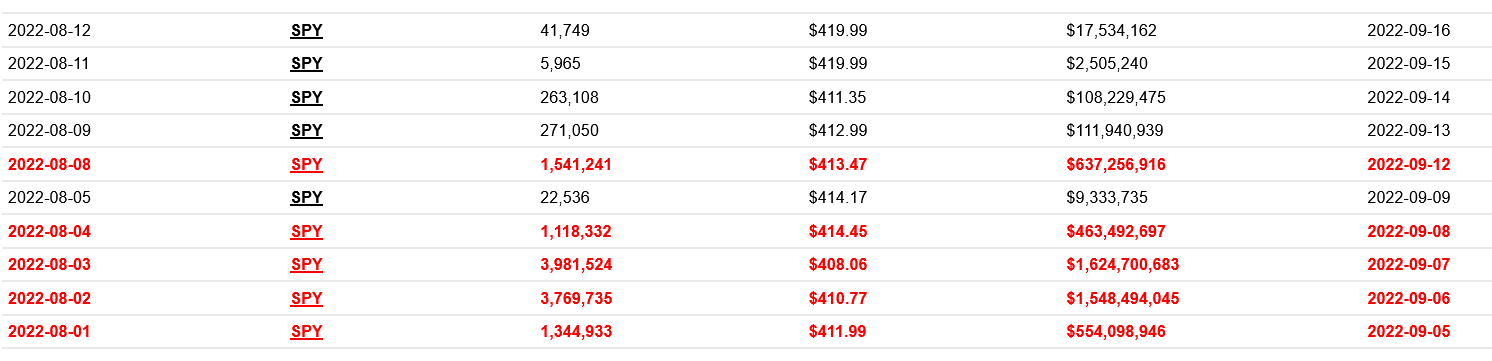
The total shares that need to be covered equals 12.36m. Average SPY volume is ~73m which again should make this covering likely inconsequential to the stock price. Similar to AMZN, there is ample liquidity in the stock to allow shorts to exit on their own terms within the 35 day window.
Another example with a bit less liquidity is SPDR Portfolio Intermediate Term Corporate Bond ETF (SPIB).
Stocksera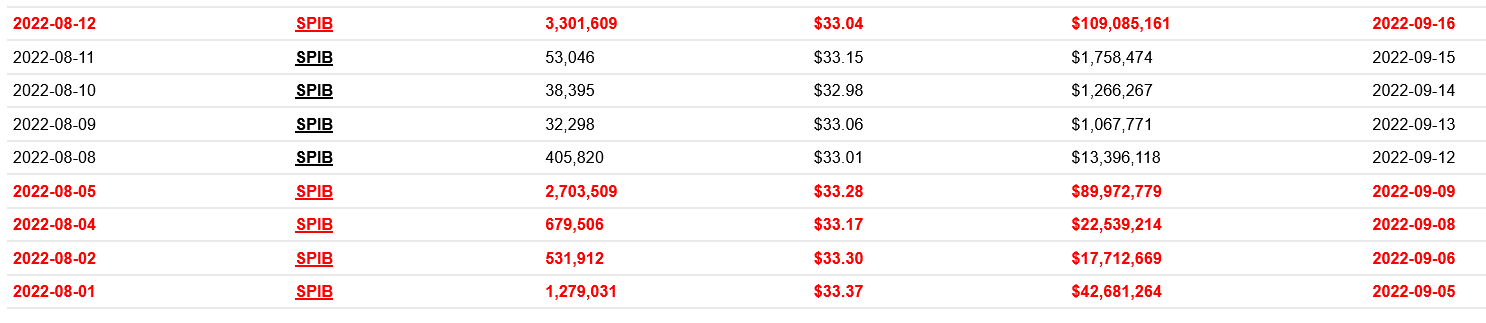
In this instance we can see that 9.025m shares need to be bought. Average volume for SPIB is only 3.8m, though it was near 4.5m earlier this month. So the amount of shares that need to be bought is actually above daily volume. The daily volume coupled with 35 days of trading should still allow shorts plenty of room to buy back shares without impacting the stock price too much.
Our final example is Principal Active High Yield ETF (YLD).
Stocksera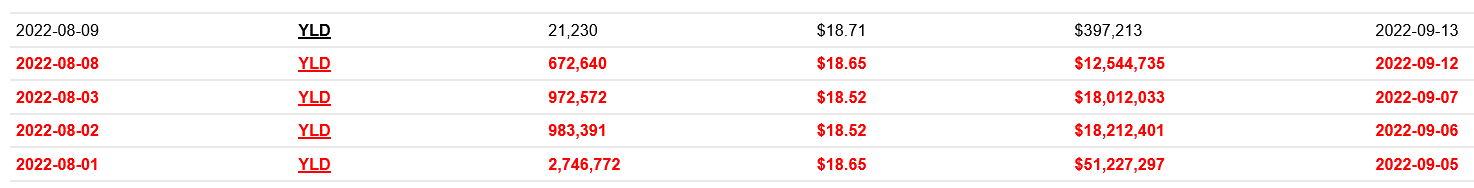
The total shares that failed to deliver is 5.397m with average volume only around 120,000. It’s also 42.7% of the total outstanding shares of 12.65m. Given these mechanics it’s possible that we could see some forced buying in YLD over the next couple of days. Again, this depends on how much covering has already been done prior to this.
Summary
Regulation SHO contains elements which create forced buyers in stocks. Investors can use this publicly available data as an alternative data set for interpreting and evaluating stock price movements. Coupling FTD data with an analysis of volume and liquidity may lead investors to important conclusions regarding when a short squeeze is potentially likely.
From a review of some high FTD stocks in early August it looks possible that YLD may see forced buyers pushing the stock price up in the coming trading sessions.
Be the first to comment