

SimonSkafar
The Utilities sector had a remarkable first half of 2022 compared to the S&P 500’s weak start. Investors found some safety in the relative stability of power generation companies that also pay out steady dividends. Moreover, the value theme featured significant alpha relative to growth through mid-June. Lately, however, high-duration plays have made a comeback. The Utilities Select Sector SPDR Fund (XLU) has retreated on both an absolute and relative basis since late in Q2 and earlier this month.
Utilities Giving Up Relative Strength
Stockcharts.com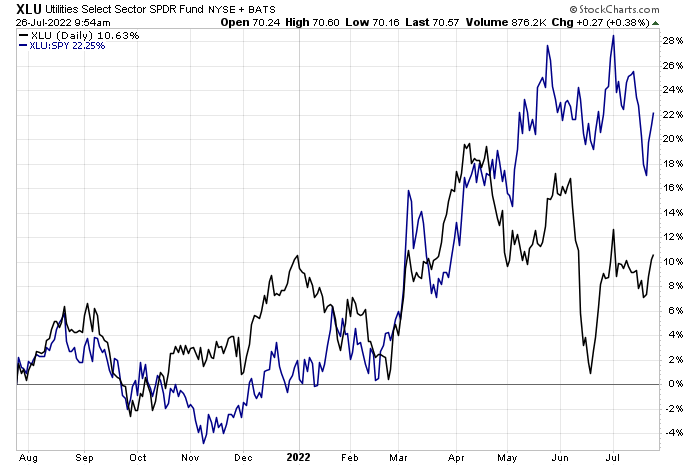
Within the “utes” space is Eversource Energy (NYSE:ES). According to Bank of America Global Research, Eversource is a regulated utility company providing electric and gas distribution as well as electric transmission services to customers in CT, MA, and NH. It also owns a water utility (Aquarion) which serves the same three states. According to The Wall Street Journal, the $30 billion market cap stock features a dividend yield of 3.0%.
Eversource is not a cheap stock – like so many utility companies at the moment. According to data from Koyfin Charts, its forward P/E ratio is above 20. That’s significantly above the stock’s 20-year average valuation which is near 16-times next 12-month earnings.
ES’s Price-to-Earnings Multiple History: Richly Valued Today
Koyfin Charts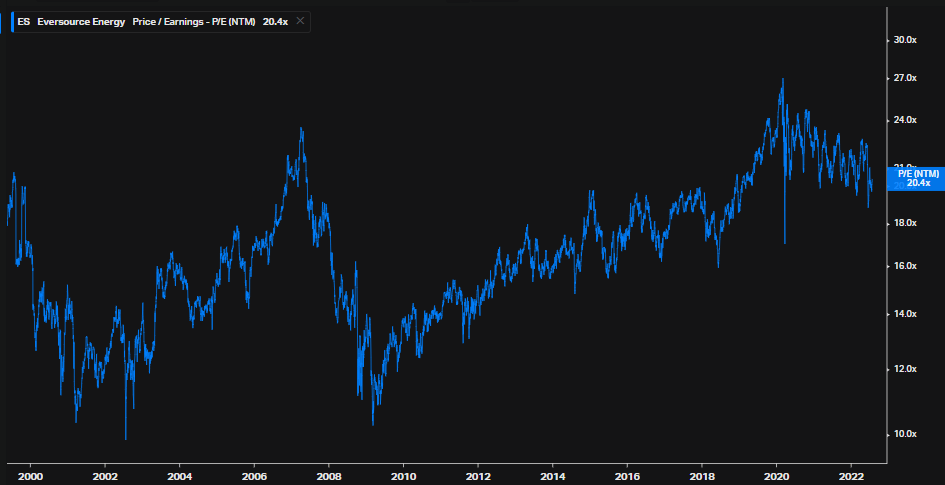
Analysts at BofA see steady growth in Eversource’s earnings per share. Assuming 6% to 7% annual earnings increases through 2024, if the stock price stays the same, its earnings multiple would contract to 19 – still high. Its yield is forecast to be steady around 3%. Unfortunately, free cash flow may be negative through the next two full calendar years.
Eversource Energy’s EPS, Valuation, Dividend Yield Forecasts
BofA Global Research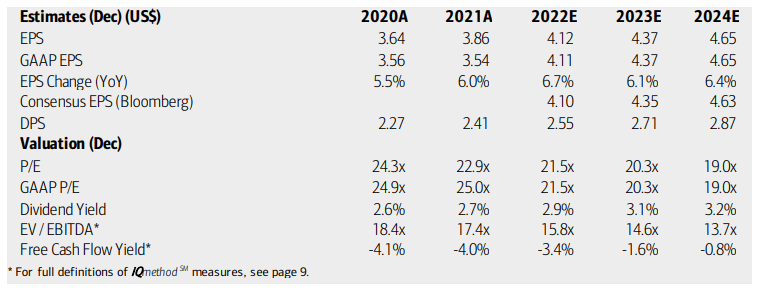
Corporate event data from Wall Street Horizon shows a confirmed earnings date of Thursday, July 28, AMC with a conference call the following morning.
Eversource’s Corporate Event Calendar: Earnings Date On Tap
Wall Street Horizon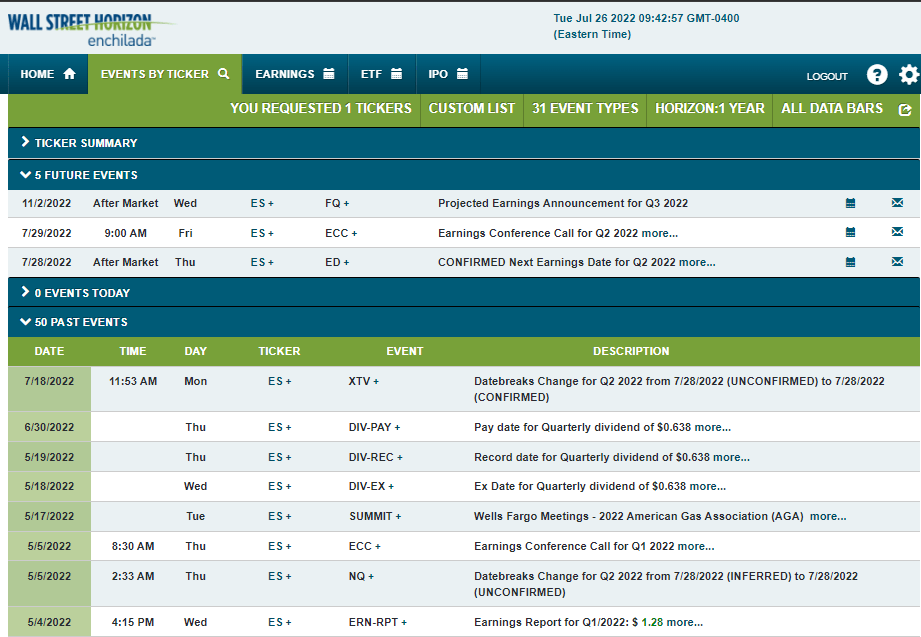
Earnings Calendar
Wall Street Horizon
Options data from ORATS show an expected earnings-related share price move of plus or minus 3.7% based on the nearest-expiring at-the-money straddle. The consensus EPS forecast for its Q2 reporting date is $0.84. There have been two downward earnings revisions since the last quarterly report. Adding to the bearish valuation is a poor EPS beat rate history – ES has missed earnings estimates in four of the last five quarters.
Earnings Trading Data: Recent EPS Misses, 3.7% Implied Move This Week
ORATS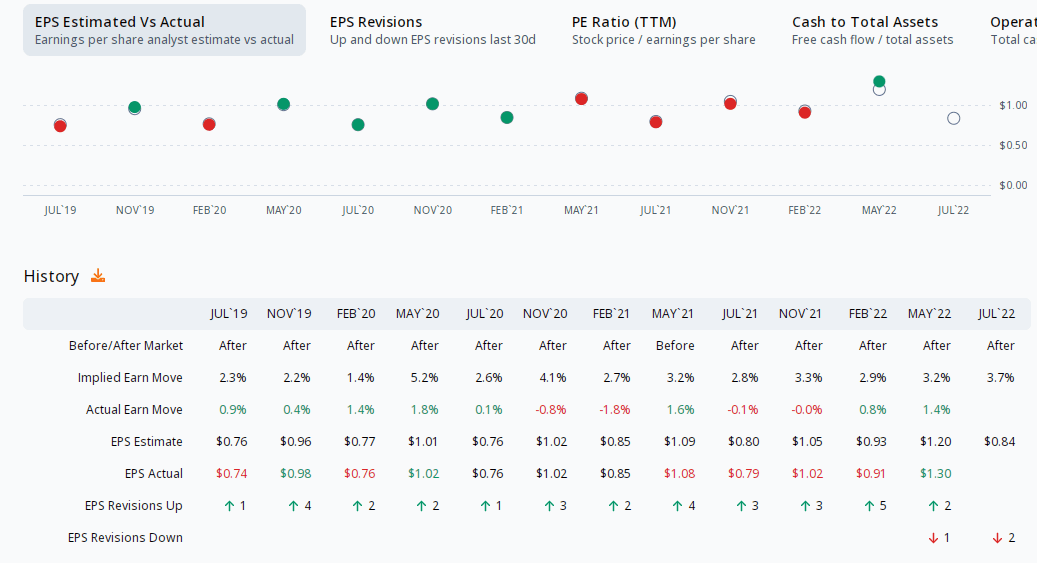
The Technical Take
Eversource’s chart shows trendless action. Traders are well-served playing the range until there are definitive signals of a bullish breakout or bearish breakdown. For now, resistance is in the $93 to $96 range while $76 to $78 is support. Should the stock breakout, the measured move would be about $113 while a breakdown would leave the stock technically vulnerable to a drop toward the $59 level.
ES: Wide Trading Range. Wait For A Breakout Or Breakdown
Stockcharts.com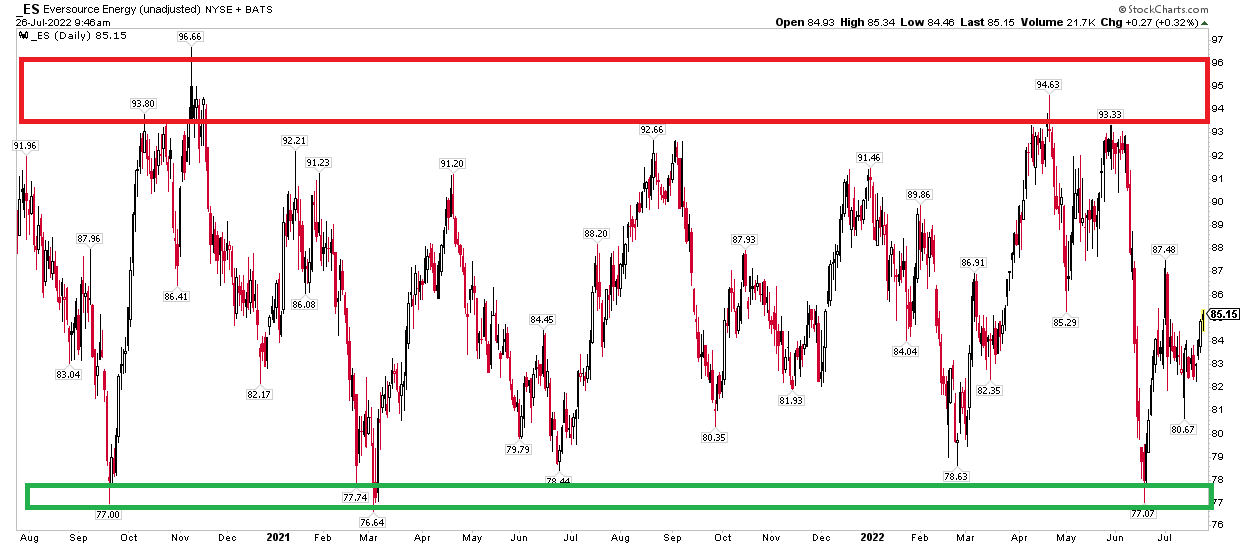
The Bottom Line
Eversource is a steady Utilities stock that finds itself in a broad trading range ahead of key earnings Thursday morning AMC. The options market expects a rather muted share price reaction, but recent EPS misses along with a high valuation make the stock unattractive in the short term and for long-term investors right now.
Be the first to comment