

Wand_Prapan/iStock via Getty Images
Investment summary + conclusion
We continue to see medium-term growth potential within diversified healthcare. After recent developments, including its Q3 financial results, we’ve retained our buy rating on The Ensign Group, Inc. (NASDAQ:ENSG).
In our last report on ENSG, we noted the company’s growth drivers that position it defensively against the contracting business cycle. Chiefly, we noted strong rental income from its new acquisitions and noted corresponding EPS accretion.
Turning to Q3 FY22, we see these growth levers well in action and management continue to meet expectations. Here, we unpack the company’s latest quarter and link it back to ENSG’s long-term value creation. We should also advise of ENSG’s $0.055 quarterly dividend that we don’t reference in this report.
Net-net, we reaffirm our buy thesis on ENSG, retaining our $100 rating.
Exhibit 1. ENSG 6-month price evolution – testing previous highs
Data: Interactive Brokers TWS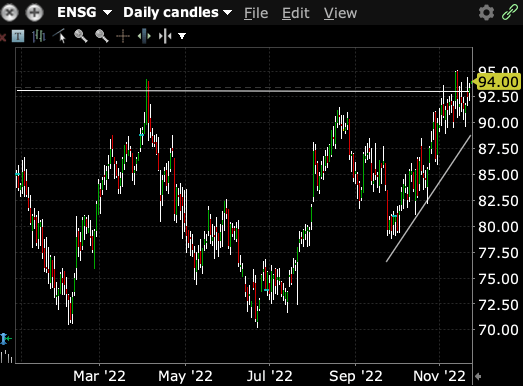
Broad market trends
Before we start, a run-through on markets. We always check the breadth and depth of equity markets to gauge positioning on the strategic and tactical side for our equity portfolios.
The SPX is curling up in a 540bps snapback rally this past month, with the Nasdaq in pursuit, up 235bps. Midcaps are leading benchmarks, with the iShares Core S&P MidCap ETF (IJH) pushing 8.5% into the money this past month also. Sector-wise, healthcare is lagging but up 6.4%, behind traditional sectors like industrials, materials [Exhibit 2]. The above data is corroborative for our bullish position on ENSG.
A trending broad market is quintessential to intensify upside potential for individual stocks in our opinion. Hence why we check these metrics in each investment appraisal.
Exhibit 2. Broad equities catching a bid in October/November, health care lagging traditional markets
Data: Seeking Alpha US Equity Sectors [Homepage]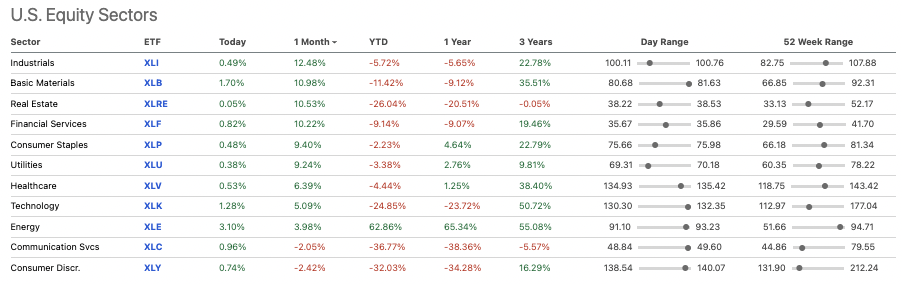
Q3 financial results
Switching to ENSG’s Q3 financials, we were pleased to note a strong performance from the top-bottom line when it reported in October. Management report total occupancy is ~77% and hence converging to pre-pandemic ranges. We also see it added 17 new operations during an acquisition-heavy quarter.
Revenue growth of 15.2% pulled in $770m at the top, with 99% of that stemming from service revenue. OpEx climbed $93mm YoY to $695.7mm driven by cost inflation, leaving ENSG $89mm in core EBITDA and net earnings of $1.04 per share.
Our key Q3 takeouts from ENSG’s acquisition income are the following:
- Standard Bearer (“SB”) added 7 new real estate operations, ENSG affiliates entered into 13 new long-term leases with 3rd party landlords. SB is now comprised of 102 properties, 74 owned by the company and 29 to senior living operations.
- Collectively operations pulled in $18.7mm in quarterly rental income, $15mm of that derived from Ensign-affiliated operations.
- We point to SB’s $12.5mm in quarterly FFO, resulting in an EBITDAR/rent cover of 2.2x at the end of Q3.
- It’s worth noting that ENSG deleveraged to just 1x net debt/EBITDA as well.
- Note: Since the quarter’s end, it also acquired a nursing facility in South Carolina, expanding the portfolio to 269 operations.
We’d like to point out a few more details that investors should be aware of for ENSG.
The company has $900mm in available capital [line of credit, on-balance sheet cash] and clipped $21.6mm in quarterly FCF [$18.6mm net of dividends]. This is an important number that can be deployed at a c.18% trailing return [Exhibit 3].
Since Q3 FY22, it has produced $135mm in FCF. Note in Exhibit 3, the degree of return ENSG has grown from its quarterly investments. Moreover, FCF has cycled and is now in-range to FY15/16′. At the same time, ROIC has continued its trajectory, reaching 17.9% in the last 12 months.
To us, we see the FCF reinvestment pull-through in ROIC each period as very attractive. SB also now owns 83 debt free assets and is growing long-term value add. In that vein, the company’s long-term value-add is clearly apparent below.
Exhibit 3. You can clearly see the long-term value build from ENSG as it grows ROIC sequentially with a FCF print in-line with FY15.
Data: HB Insights, ENSG SEC Filiings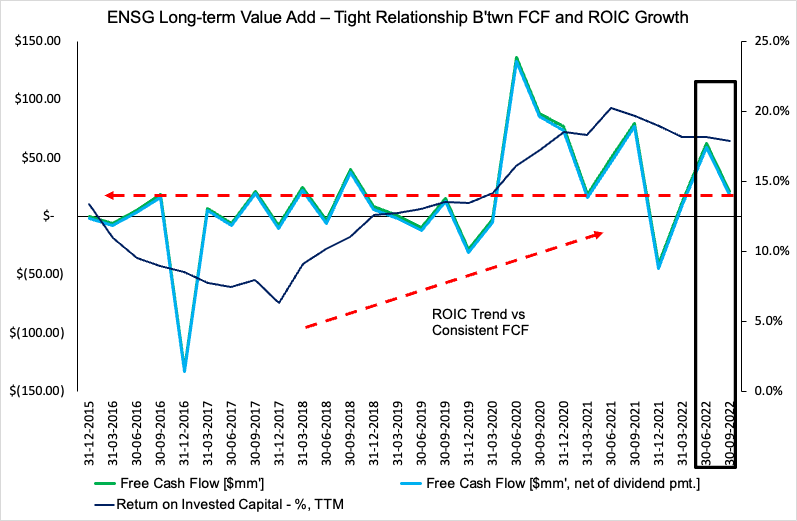
Guidance revision points to EPS upsides ahead
Management revised FY22 EPS guidance to the upside following the strong quarter. It now sees FY22 EPS in a range of $4.10-$4.18, up from $4.05-$4.15 previously. These forecasts are built on revenue growth projections of $3.03Bn at the upper range, calling for a 14% YoY growth.
In contrast, we see a 15% growth at the top for ENSG with core EBITDA of $386mm, pulling down to $309mm in pre-tax income and $4.14 in EPS. It’s not unreasonable to see ENSG growing earnings at 14-15% per quarter in FY23.
We form these growth assumptions from company’s growth and acquisition strategy that we discussed last time [see: “Exhibit 2: New acquisitions [post-Jan FY21] have been accretive to the top and bottom lines; and: “Exhibit 5: Quarterly NOPAT return on investment continues to exhibit resiliency”].
You can see our projected revenue walk for ENSG into FY24′ below.
Exhibit 4. ENSG Forward estimates [qrtly, annual] FY22-24′
Data: HB Insights Estimates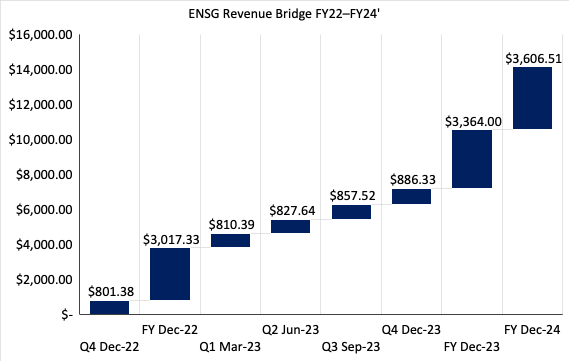
Exhibit 5. ENSG Forward EPS Estimates [as above]
Data: HB Insights estimates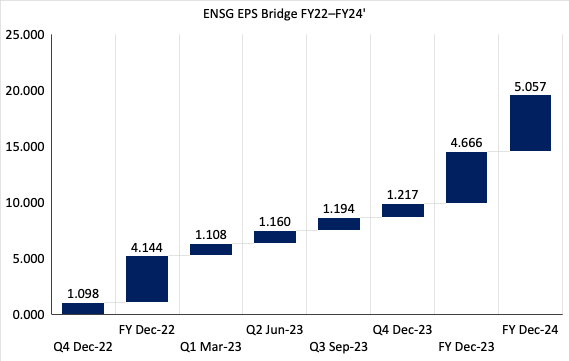
Valuation and conclusion
We agree with consensus in valuing ENSG in 23-24x forward P/E. This reflects an accurate risk/reward in the name in our estimation. With the S&P 500 estimated to trade at a 18.18x forward P/E for FY22, we project ENSG to outperform the benchmark.
We valued ENSG at $100 in our last report and this is reflected in the company’s new growth estimates [Exhibit 6]. To clarify, this is 24.23x FY22 EPS estimates of $4.14.
With ENSG on target to hit this objective, this confirms our buy thesis again, along with factors discussed earlier in this report.
Exhibit 6. We priced ENSG at $100 last time and this is reflected in the company’s latest growth numbers, confirming our buy thesis.
Note: Fair forward price-earnings multiple calculated as 1/fair cost of equity. This is known as the ‘steady state’ P/E. For more and literature see: [M. Mauboussin, D. Callahan, (2014): What Does a Price-Earnings Multiple Mean?; An Analytical Bridge between P/Es and Solid Economics, Credit Suisse Global Financial Strategies, January 29 2014]. (Data: HB Insights Estimates)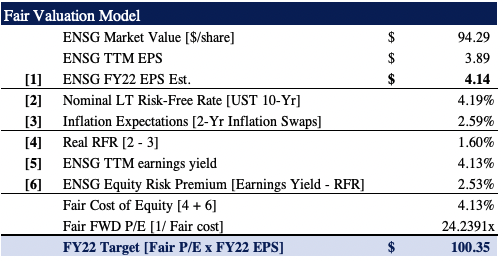
Net-net, we reaffirm out buy thesis on ENSG following its latest numbers and see shares heading to $100. Key risks to the investment thesis include:
- A further selloff in broad equity markets
- ENSG missing its Q4 FY22 numbers
- Macroeconomic risks hurting corporate earnings, especially central bank tightening.
- These risks would pose a potential threat to our upside thesis.
Be the first to comment