

andresr/E+ via Getty Images
The Pacer US Cash Cows 100 ETF (BATS:COWZ) invests in companies that offer a high free cash flow yield. The idea here is that the ability to generate free cash is a good indicator that a “cash cow” business is high-quality and financially sustainable. A high free cash flow yield can also imply a company is fundamentally undervalued while capable of generating long-term capital appreciation
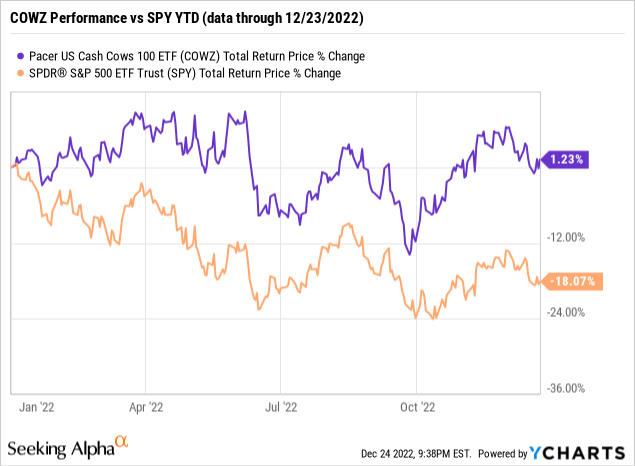
Indeed, the strategy has worked with COWZ delivering a positive return in 2022 despite the challenging macro backdrop and extreme volatility in the broader market. There’s a lot to like about COWZ although investors should pay close attention to its portfolio positioning as the current concentration in energy exposes some of the drawbacks of the strategy as a long-term holding. A shifting market environment in 2023 could mean the fund underperforms going forward.
What is the COWZ ETF?
COWZ follows a rules-based methodology that starts with the components of the Russell 1000 Index, representing the largest 1,000 U.S. companies by market capitalization, as the initial screening universe. Companies with positive projected free cash flow and earnings over the next two fiscal years based on consensus estimates are considered. The group of stocks is further ranked by their free cash flow yield for the trailing twelve-month period.
Notably, financial sector companies other than REITs are excluded, as the free cash flow metric is typically less relevant for businesses like banks or asset management firms. The underlying weightings for the final 100 stocks are set in proportion to each stock’s trailing free cash flow yield and capped at 2% for any individual holding.
Overall, compared to the Russell 1000 and S&P 500, COWZ ends up having a value style tilt evident by a fund P/E ratio at 6.5x which is at a discount to the broader market. The fund’s reported free cash flow yield of 12.3% is well above the 3.6% from its benchmark.
source: Pacer Funds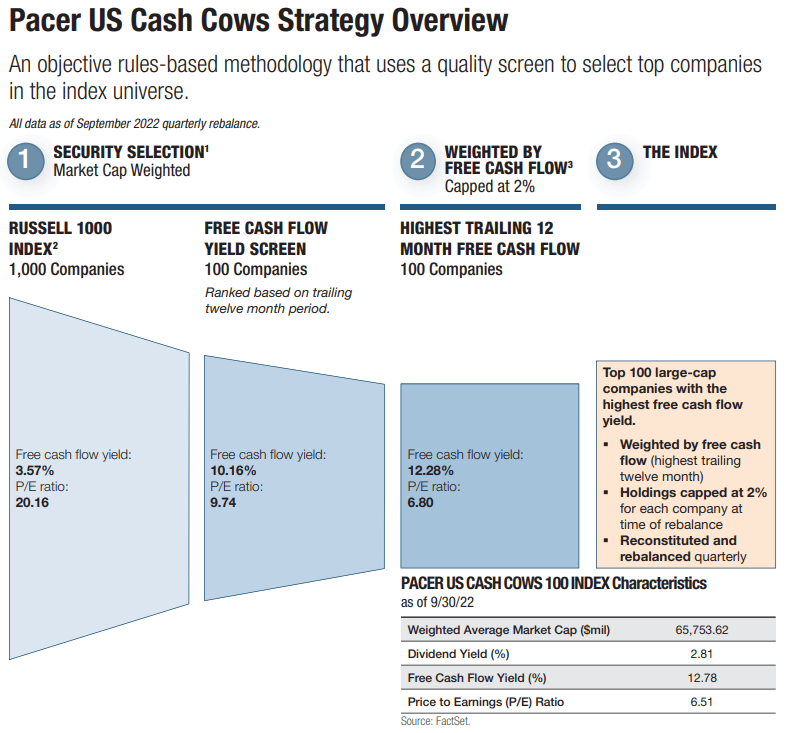
While not a primary focus of the strategy, COWZ dividend yield listed at approximately 2% is slightly higher than its benchmark. The explanation here is that by excluding un-profitable companies that don’t generate positive free cash flow, COWZ captures more dividend payers and dividend growers on average.
The other important point here is the fund’s quarterly reconstitution and rebalancing, which reset both the underlying holdings and their respective weights based on the updated free cash flow yield. The result is that companies, where the free cash flow yield has climbed during a quarter, can gain importance, or inversely have their exposure reduced as the yield falls. There are many moving parts to that dynamic but it’s worth considering as recent big winners would tend to be sold while recent losers added as an implication of the strategy mechanics.
COWZ Portfolio
For our purposes of comparison, we’ll reference the Russell 1000 ETF (IWB) as the benchmark but note that the index in practice is very similar to the more widely-followed S&P 500 Trust (SPY) given both are market-weighted and dominated by the same mega-cap constituents. In other words, IWB and SPY are closely correlated while the COWZ “cash-cows” strategy displays a more distinct profile.
The first observation comes down to the exposure breakdown of COWZ where energy companies representing 33% of the fund are significantly above the sector weight in SPY and IWB where energy is closer to 5%. This makes sense considering what has been a record year for oil and gas producers benefiting from high market prices, which translates directly into profits and elevated free cash flow.
The performance of Materials sector companies through other commodities has been more mixed, but the group plays a key role in COWZ at 17% of the current composition. The energy sector and materials sector together represent 50% of the fund, which is high in our opinion.
source: Pacer Funds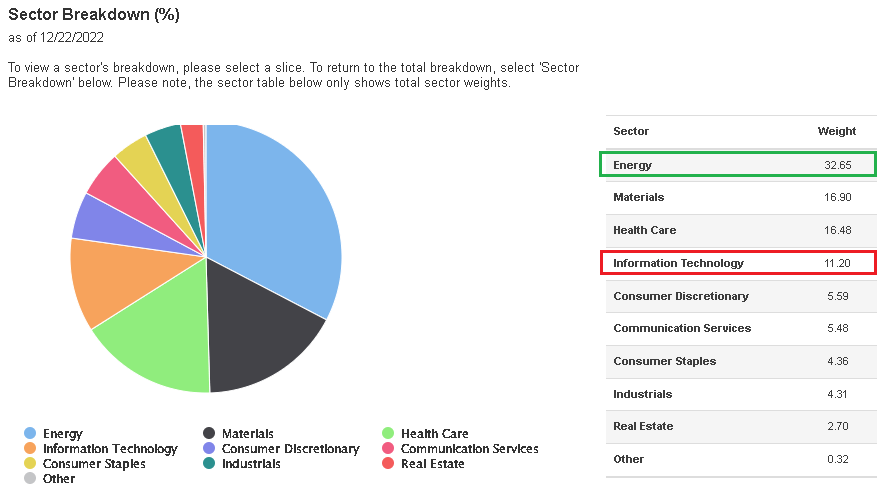
On the other hand, compared to the benchmark, COWZ is underweight the technology sector which represents 11% compared to 24% in SPY. In this case, COWZ has been able to limit its exposure to one of the worst-performing sectors this year considering the group of high-growth and momentum-type names generally do not generate high levels of free cash flow. Separately, notice that COWZ has zero exposure to financials which is an important sector for the broader market, but was defined in 2022 as under pressure against climbing interest rates.
Seeking Alpha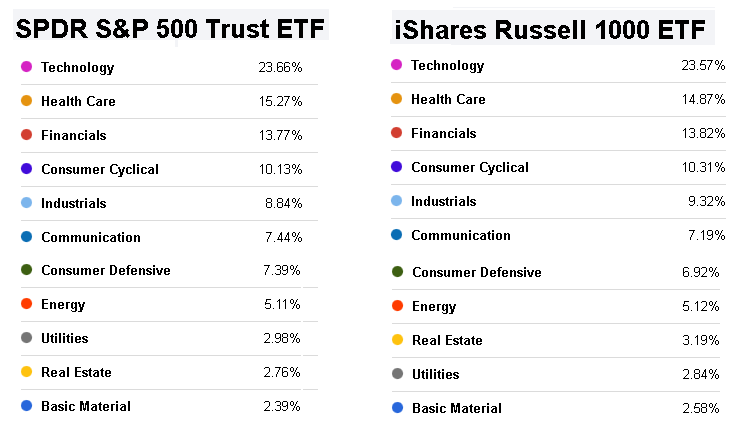
In terms of the individual stocks, the largest holdings cover names several “blue-chip” names like Pfizer Inc (PFE), Exxon Mobil Corp (XOM), Chevron Corp (CVX), Dow Inc (DOW), and Altria Group Inc (MO). With Moderna Inc (MRNA), it’s curious that the company does not pay a dividend, although its level of free cash flow justifies its inclusion in the fund. That’s the case with smaller holdings in names like Zoom Video Communications Inc (ZM), Live Nation Entertainment Inc (LYV), or even Expedia Group Inc (EXPE) which highlight some diversity.
What’s more telling are the companies that are not included in the COWZ portfolio among mega-cap stalwarts like Amazon.com Inc (AMZN), Meta Platforms Inc (META), or Tesla Inc (TSLA) that are responsible for dragging lower the overall market.
source: Pacer Funds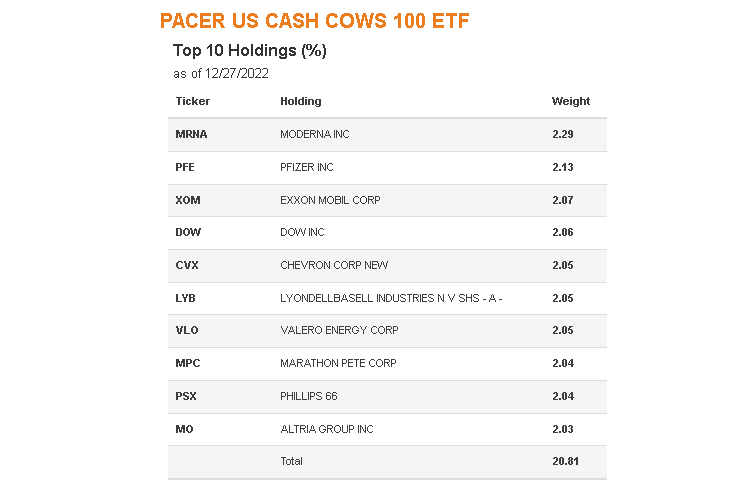
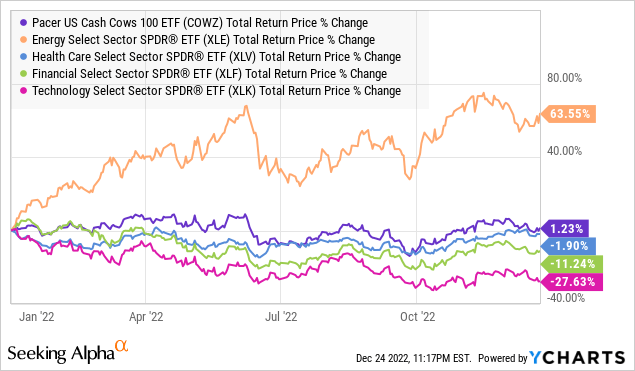
The takeaway here is that COWZ’s performance in 2022 can largely be tied to its particular positioning towards sectors like Energy and Healthcare that proved to be resilient amid a challenging macro environment. The strategy of focusing on free cash flow was able to capture various trends from inflation beneficiaries to the defensive aspect of companies with strong fundamentals.
What’s Next for COWZ
It’s impressive that COWZ has outperformed both SPY and IWB since its fund inception date back in December 2016. From the chart below, COWZ also beats out some other high-profile strategy funds like the Vanguard Dividend Appreciation ETF (VIG) which targets companies that increase their annual shareholder payouts, along with the BTC iShares MSCI USA Quality Factor ETF (QUAL) that looks for companies with overall strong fundamentals.
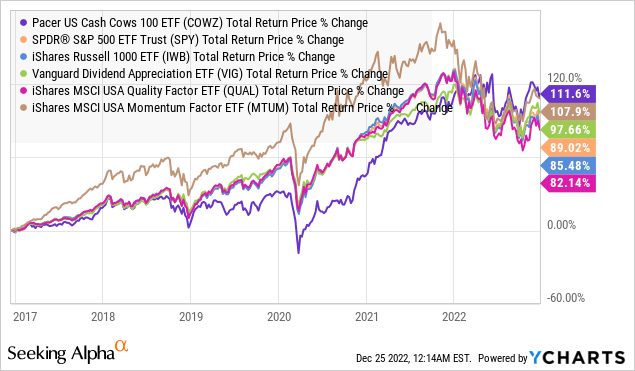
The caveat here is that the bulk of that performance spread has come this year with COWZ trailing the group by a large spread between 2019 and 2021 which was particularly strong for equity returns. By this measure, there is a case to be made that the cash-cows strategy of focusing on companies with high cash flow yields could underperform again in the next bull market.
The reason for this possible reversal is that the market could once again favor high-growth names with less importance given to near-term earnings or free cash flow generation. This would be reflected in the technology sector leading higher while value or defensive groups like energy take a back seat.
Entering 2023, the fund is in a tricky spot considering its concentrated exposure to not only energy but also the basic materials sector which together represent nearly half of the fund. For the macro pessimists, in a scenario where global growth sharply deteriorates into a deepening recession, the weaker demand could translate into lower commodity prices as a bearish trend towards those cyclical type companies.
We can also envision a rosier outlook where maybe inflation surprises sharply lower, opening the door for the Fed to shift its monetary policy towards lower rates. This setup coupled with stronger-than-expected economic growth could be very bullish technology and many of the beaten-down mega-cap names where COWZ is specifically underweight relative to its benchmark and the broader market.
Even as the fund strategy has a mechanism to reconstitute and rebalance on a quarterly schedule, presumable rotating out of energy, this may not be fast enough to avoid being on the wrong side of the trade. From there, a bullish call on COWZ would likely depend on more of the status quo being ongoing volatility and risk aversion as a tailwind for defensive-type sectors. That said, for investors particularly bullish on energy and commodities, a more sector-specific fund would likely better capture those tailwinds.
COWZ Price Forecast
We rate COWZ as a hold balancing a positive view of the strategy against near-term macro uncertainties that could translate into higher volatility given the current portfolio positioning. From the chart, the area around $50.00 appears to represent a strong level of resistance COWZ may have trouble climbing over. On the downside, an opportunity to pick up shares under $42.00 could represent a better reward-to-risk entry point.
To conclude, COWZ’s focus on investing in high free cash flow-yielding stocks proved to be a winning trade in 2022, although it’s unclear whether the fund can repeat that success in 2023.
Seeking Alpha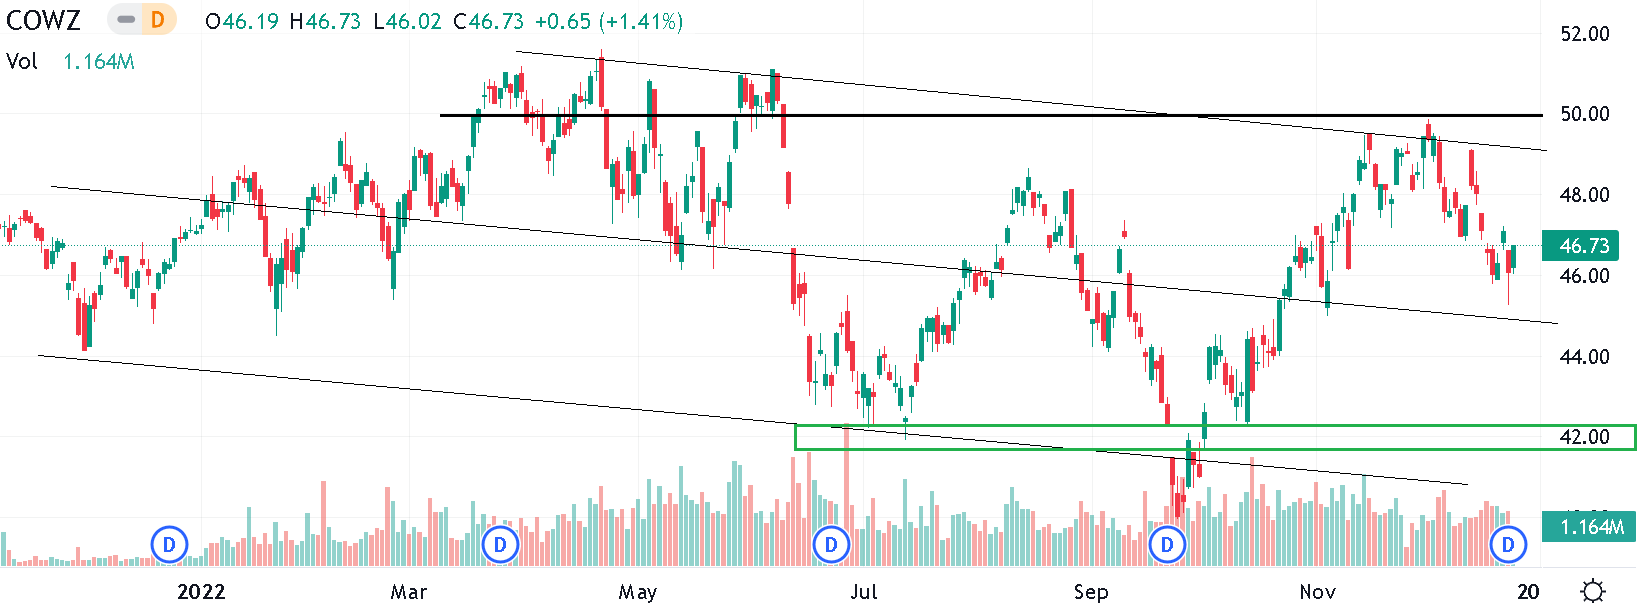
Be the first to comment