

grandriver
Introduction
We are approaching the fourth quarter release, and I believe it is time to look at the company as we enter 2023 to see how Coterra Energy (NYSE:CTRA) will likely perform this year. 2023 will be more challenging for the company for obvious reasons.
Oil and natural gas prices have dropped tremendously since their peak in 2022, as shown in the chart below.
CTRA Brent Natgas 1-year chart (Fun Trading StockCharts)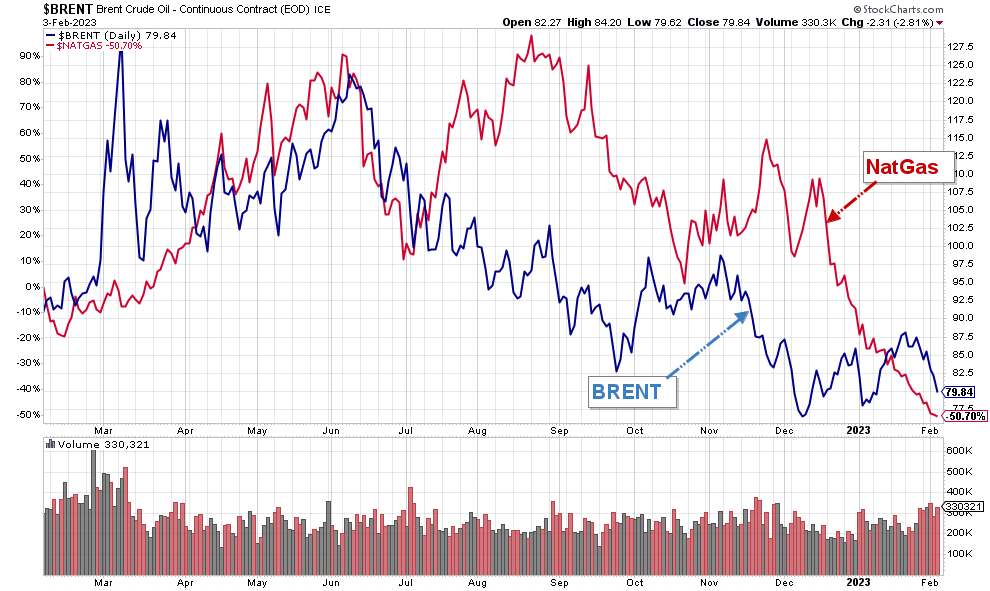
Houston-based Coterra Energy released its third-quarter 2022 results on November 5, 2022.
Note: I have followed CTRA quarterly since October 2017 (Cabot oil). This new article is a quarterly update of my article published on August 11, 2022. Also, the company indicated in its most recent presentation the 2022 guidance.
1 – Presentation
Reminder: Cabot Oil & Gas and Cimarex Energy Co. completed the merger on October 1, 2021. It was a merger valued at $17 billion.
The company’s production is primarily natural gas, representing 73% and 13% of Natural gas liquid, leaving 14% for oil.
CTRA Presentation map (CTRA Presentation)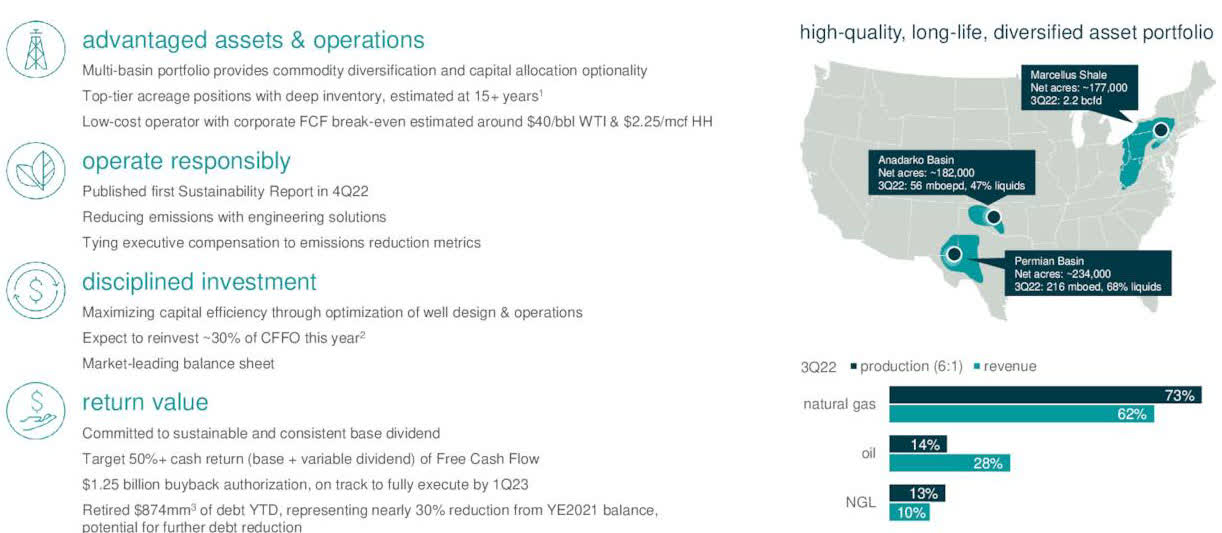
The company produces oil, NGL, and natural gas from three US basins (Marcellus, Permian, and Anadarko).
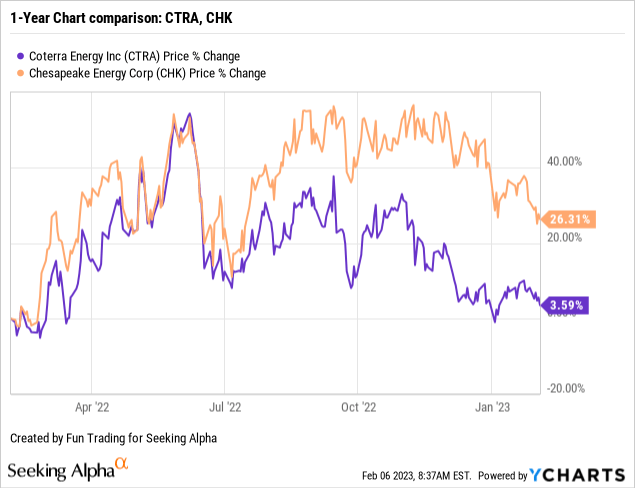
2 – Stock performance
I cover Coterra Energy and Chesapeake Energy (CHK) in this segment. Both companies dropped significantly from their high in June 2022. CTRA underperformed CHK on a one-year basis and is now up 4%.
3 – Investment Thesis entering 2023
The investment thesis has changed again for Coterra Energy as oil and gas prices continue to correct from the exceptional year 2022. The EIA forecasts lower wholesale U.S. natural gas prices in 2023 and 2024. It seems that the best days are behind us.
forecast the natural gas spot price at the U.S. benchmark Henry Hub will average $4.90 per million British thermal units (MMBtu) in 2023, more than $1.50/MMBtu lower than the 2022 average. We expect prices to stay nearly the same in 2024 as dry natural gas production continues to grow in the United States and outpaces domestic natural gas demand and exports for most of the year.
On the other hand, oil prices are expected to stay healthy at between $80 and $95 in 2023.
For 2023, half of the surveyed energy professionals—of whom 22% are directly involved in oil and gas production—expect Brent Crude to average between $80 and $95 per barrel. Most of the people polled, more than 90%, see Brent averaging between $70 and $105. The average of all forecasts is $87 a barrel for this year.
Based on those forecasts, it is evident that CTRA will struggle in 2023 due to the nature of its production, which is highly oriented to natural gas. Profit margins will be squeezed, and free cash flow is expected to drop.
Thus, I recommend a long-term CTRA position combined with active short-term trading (60%) to take advantage of the sector’s weakness and slightly increase overall risks.
Coterra Energy CEO Tom Jorden said in the conference call:
Our Permian, Marcellus and Anadarko business units all posted outstanding economic returns in spite of inflationary headwinds.
Coterra Energy – Balance Sheet History ending 3Q22: The Raw Numbers
| COG | 3Q21 | 4Q21 | 1Q22 | 2Q22 | 3Q22 |
| Total Revenues in $ Million | 440 | 2,224 | 1,679 | 2,572 | 2,520 |
| Net Income in $ Million | 63 | 938 | 608 | 1,229 | 1,196 |
| EBITDA $ Million | 193 | 1,649 | 1,159 | 2,023 | 1,965 |
| EPS diluted in $/share | 0.16 | 1.16 | 0.74 | 1.52 | 1.50 |
| Cash from operations in $ Million | 245 | 952 | 1,322 | 879 | 1,771 |
| Capital Expenditure in $ Million | 185 | 269 | 271 | 474 | 460 |
| Free Cash Flow in $ Million | 61 | 683 | 1,051 | 405 | 1,311 |
| Cash and cash equivalent $ Million | 76 | 1,036 | 1,447 | 1,059 | 778 |
| Total Debt (incl. current) In $ Million | 947 | 3,125 | 3,115 | 3,105 | 2,282 |
| Dividend per share in $ per share | 0.30 | 0.56 | 0.60 | 0.65 ($0.15 + $0.50) | 0.68 ($0.15 + $0.53) |
| Share outstanding diluted in Million | 403 | 814 | 814 | 808 | 797 |
| Gas Production | 3Q21 | 4Q21 | 1Q22 | 2Q22 | 3Q22 |
| Gas Equivalent Production in K Boepd | 393.8 | 686.2 | 629.9 | 631.7 | 641.2 |
| NG price per Mcf | 2.95 | 4.43 | 4.17 | 5.15 | 6.37 |
Source: Company filings.
Trends, Charts, and Commentary: Revenues, Free Cash Flow, and Gas Production
1 – Total Revenues were $2,520 million in 3Q22
CTRA Quarterly Revenues history (Fun Trading)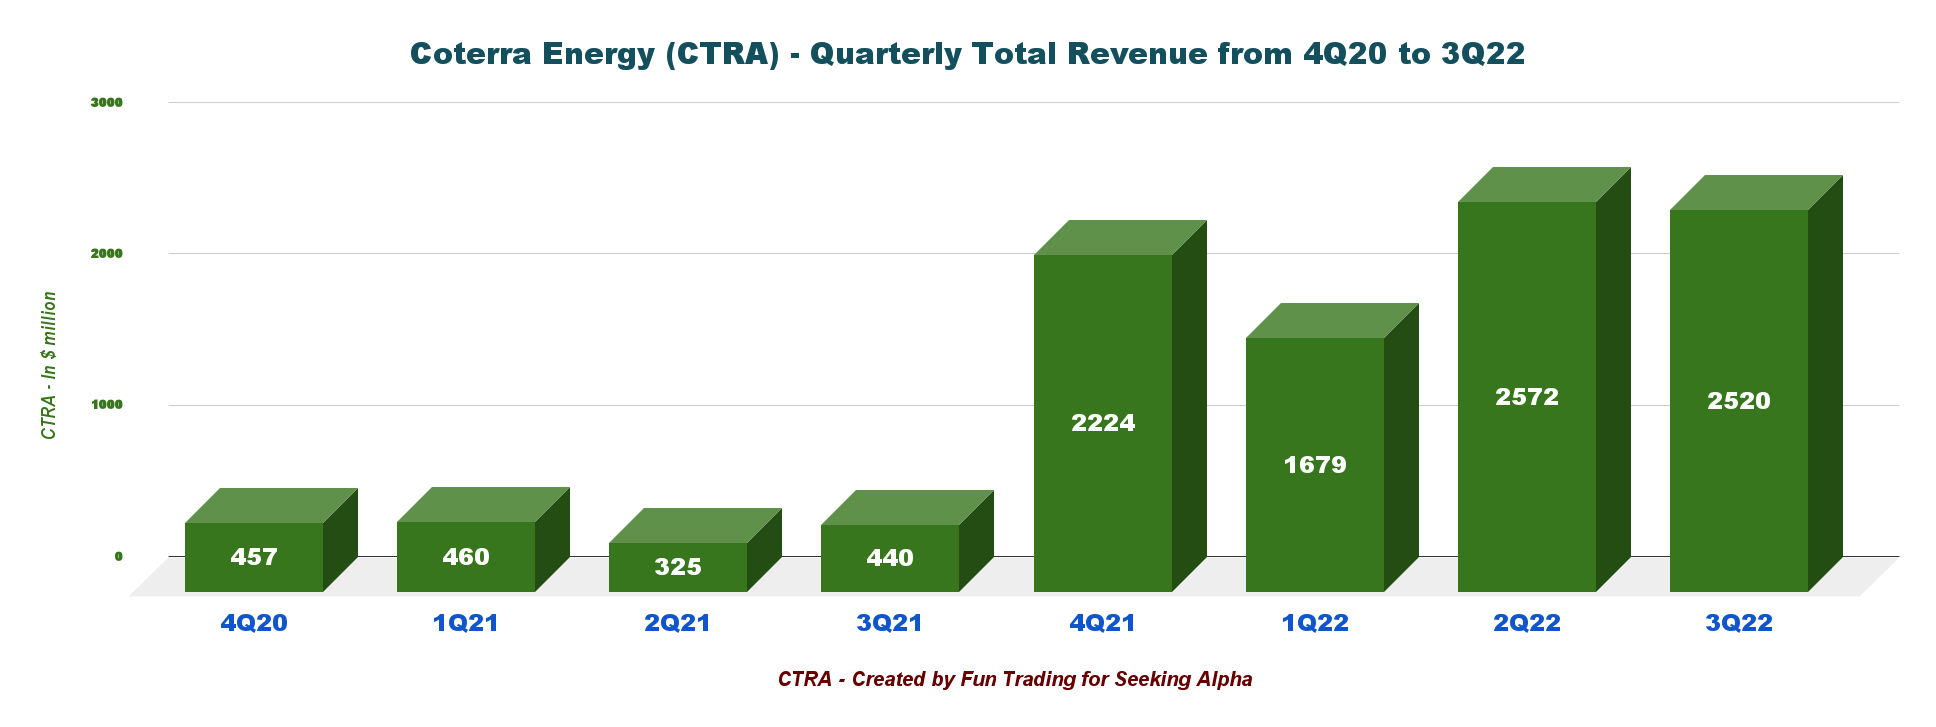
Coterra Energy recorded quarterly revenues of $2,520 million for the third quarter of 2022, down from $2,572 million in 2Q22.
The net income was $1,196 million in 3Q22, or $1.50 per share. However, I do expect a lower income for 4Q22.
2 – Free cash flow jumped to $1,311 million in 3Q22
CTRA Quarterly Free cash flow History (Fun Trading)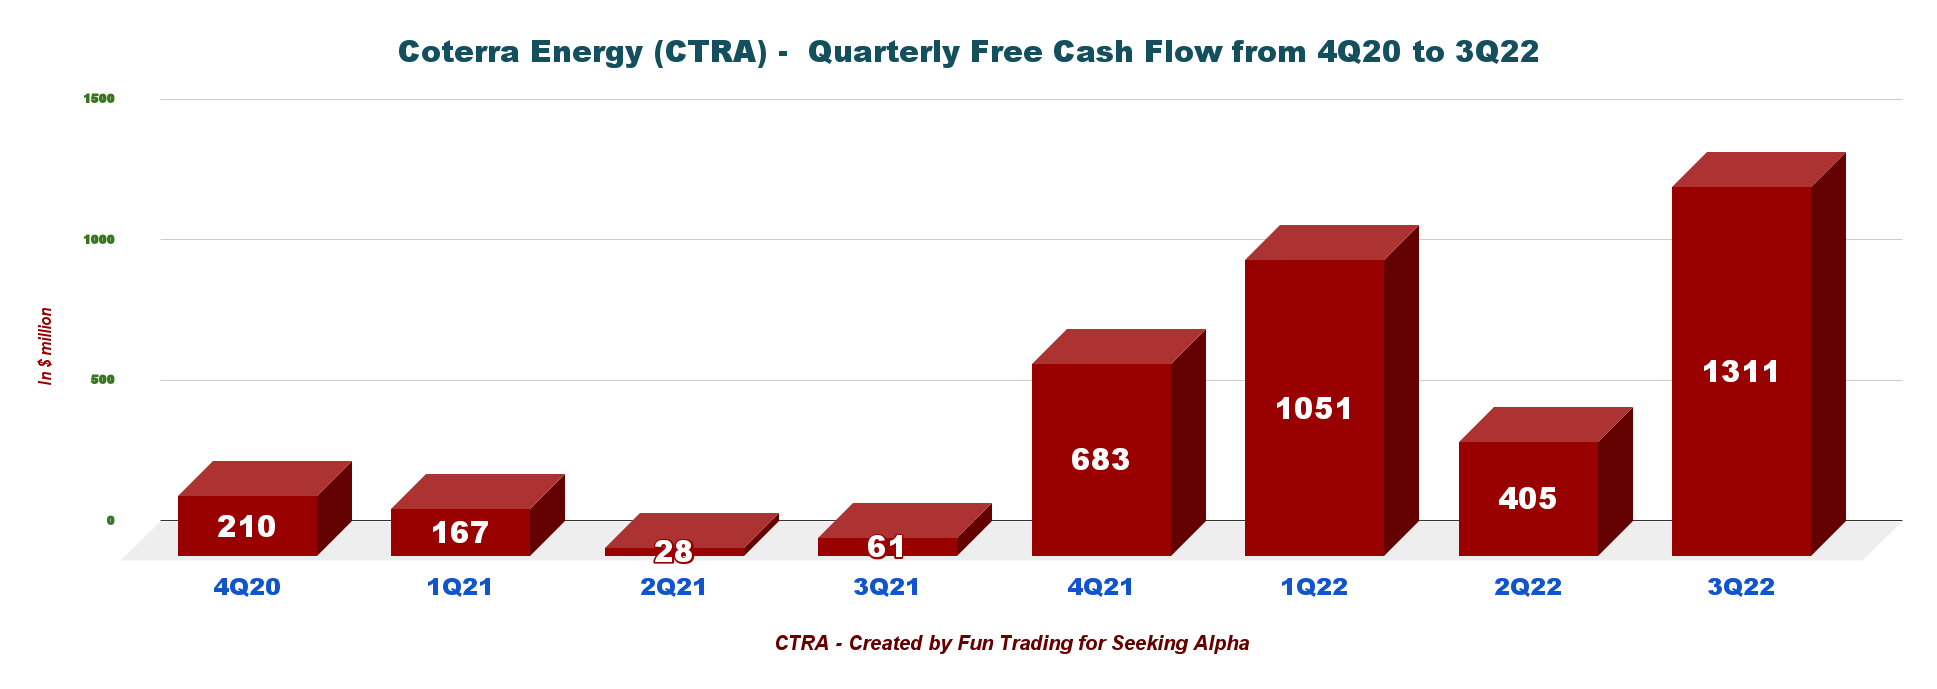
Note: The generic free cash flow is the cash from operations minus CapEx. The company has a different way of calculating the free cash flow.
CTRA’s free cash flow was $1,311 million in 3Q22. The trailing 12-month free cash flow TTM was $3,449 million.
On August 2, 2022, Coterra’s Board of Directors approved a quarterly dividend of $0.68 per share ($0.15 base, $0.53 variable).
3 – Quarterly Oil Equivalent production
Coterra Energy operates in three different basins in the USA.
CTRA Quarterly Production per segment 2Q22 versus 3Q22 (Fun Trading)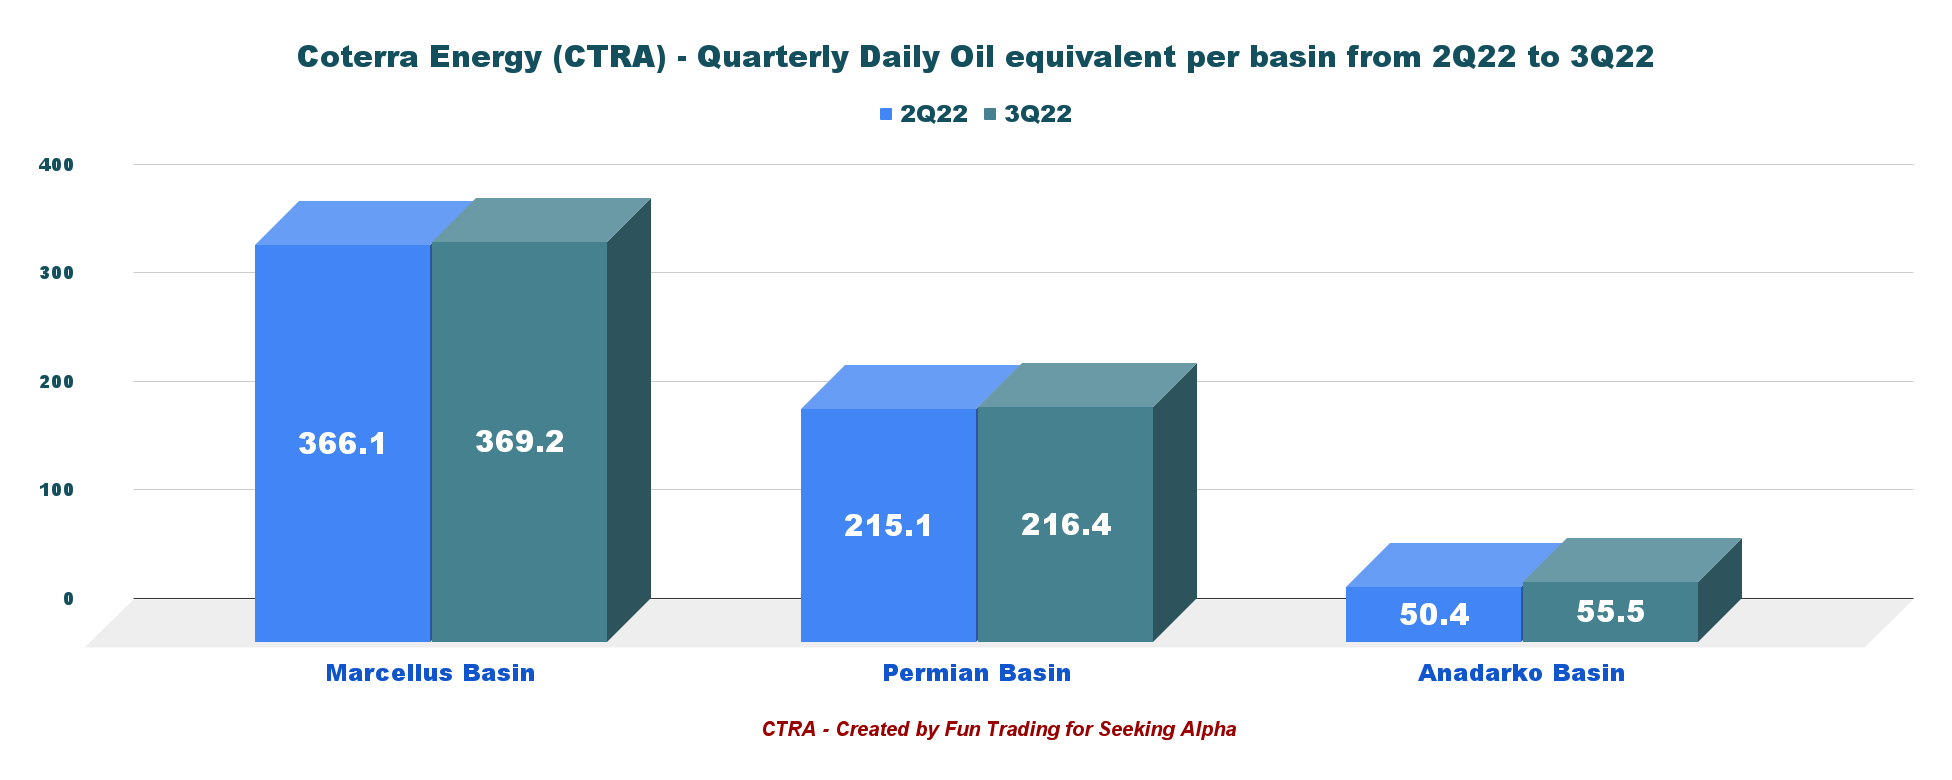
Coterra Energy produced 641.2K Boepd in 3Q22, up from 631.7K Boepd in 2Q22.
CTRA Quarterly oil equivalent production history (Fun Trading)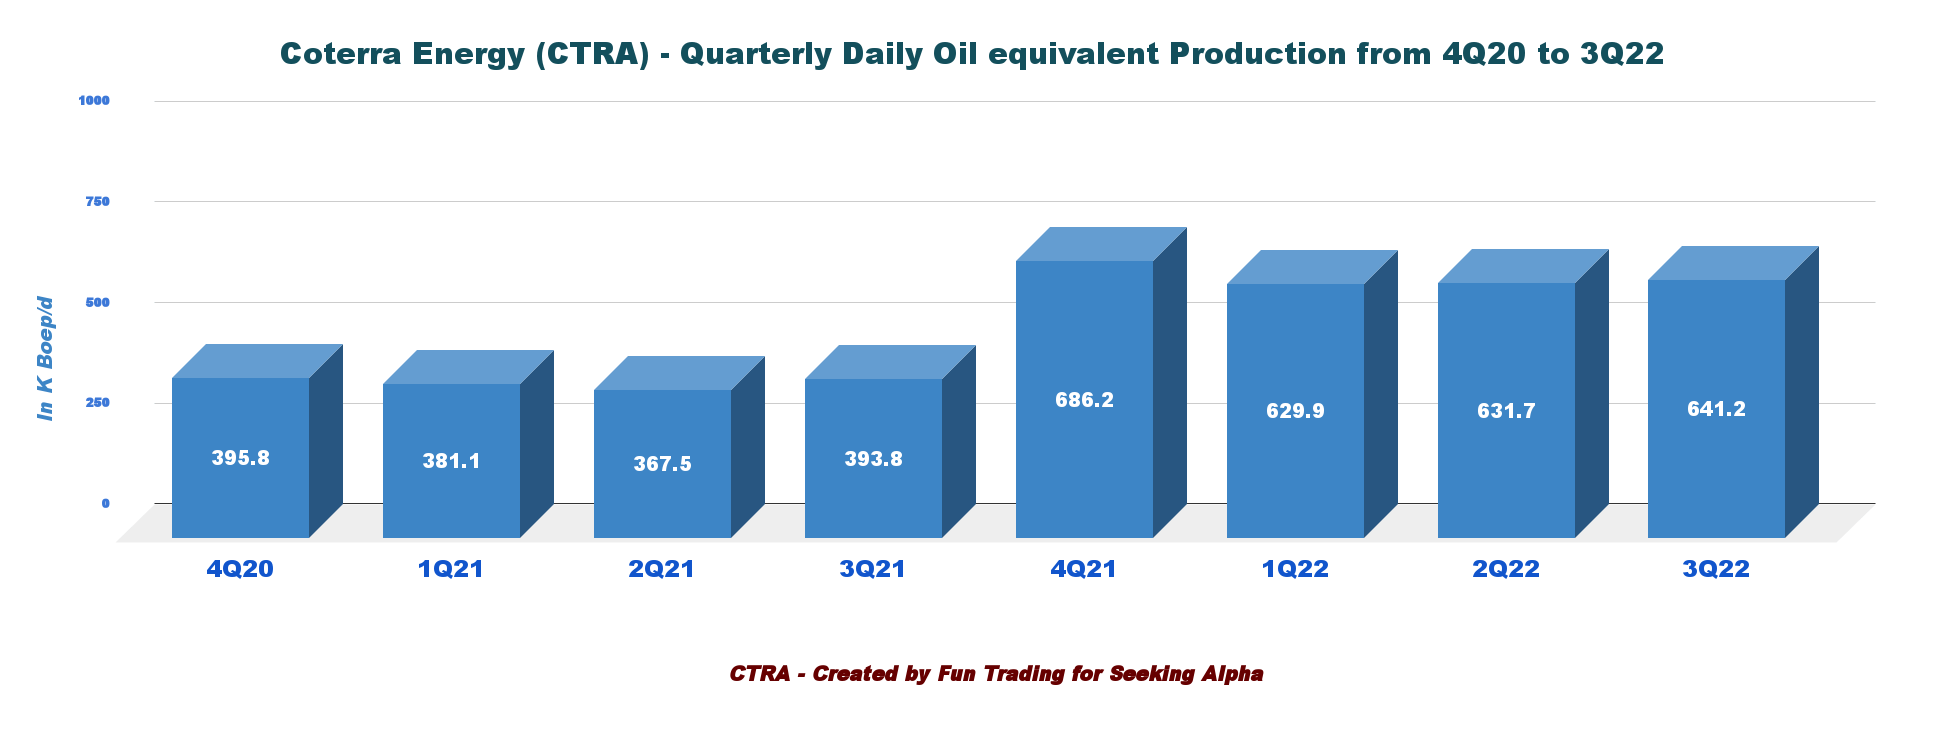
The average realized natural gas price increased to $6.37/Mcf from the year-ago quarter’s $2.95. The oil price was $99.35 per barrel, and NGL was $32.78. However, the upcoming 4Q22 will show a significant drop.
CTRA Quarterly oil, NGL, and NG prices history (Fun Trading)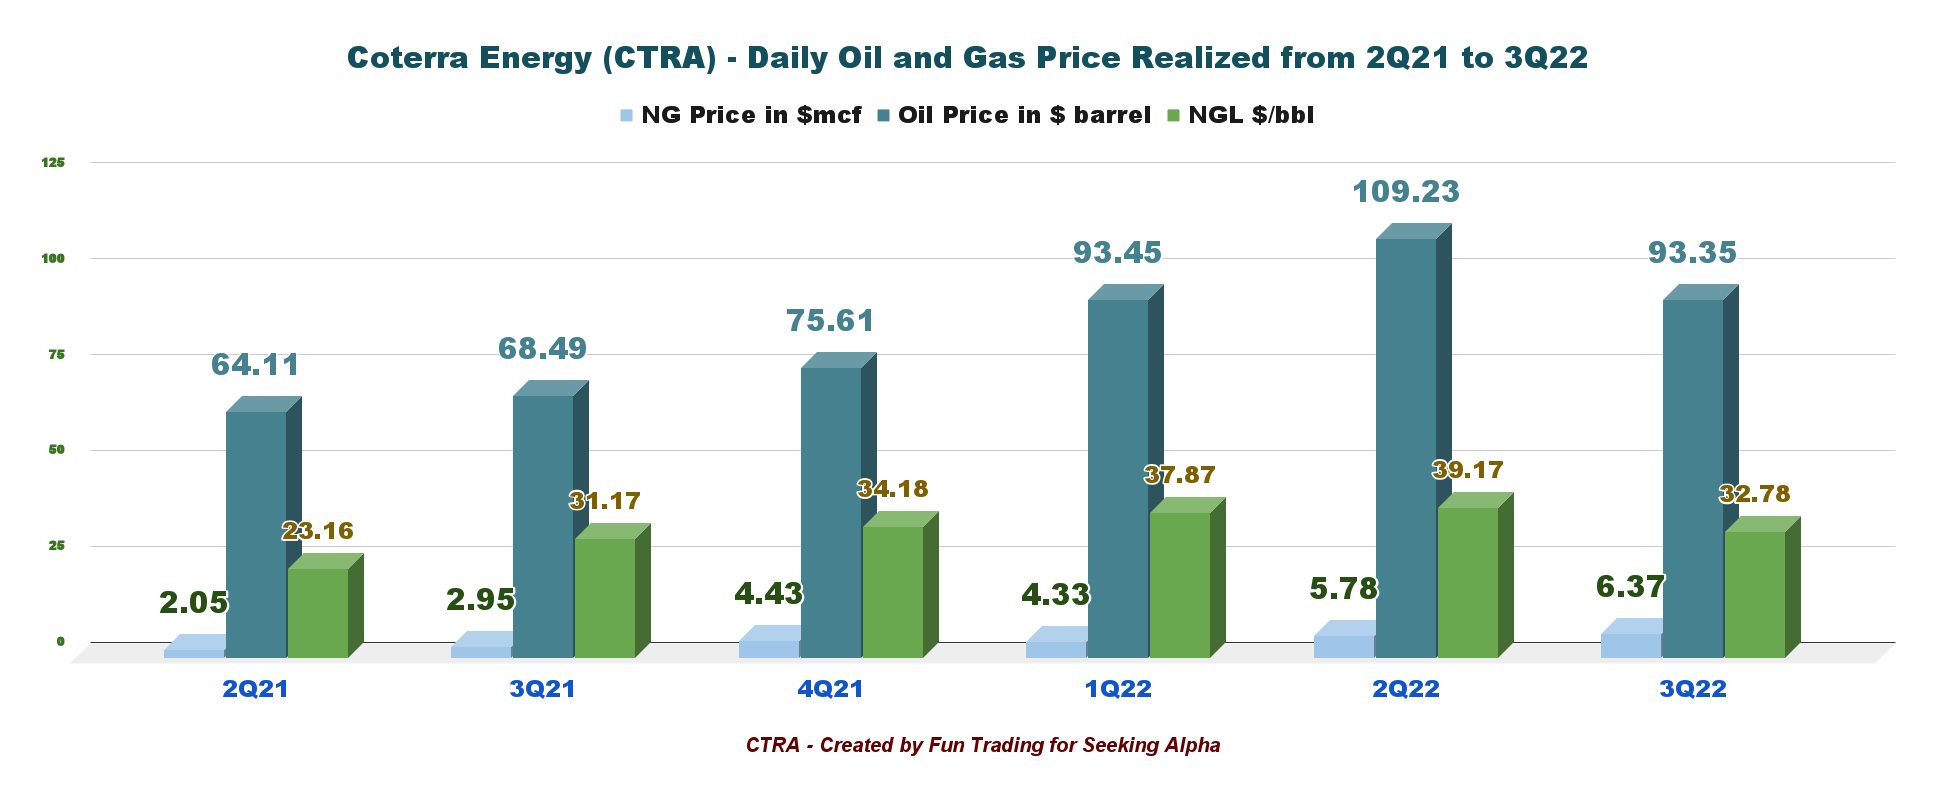
4 – Net Debt is $1.45 billion as of 3Q22
CTRA Quarterly Cash versus Debt history (Fun Trading)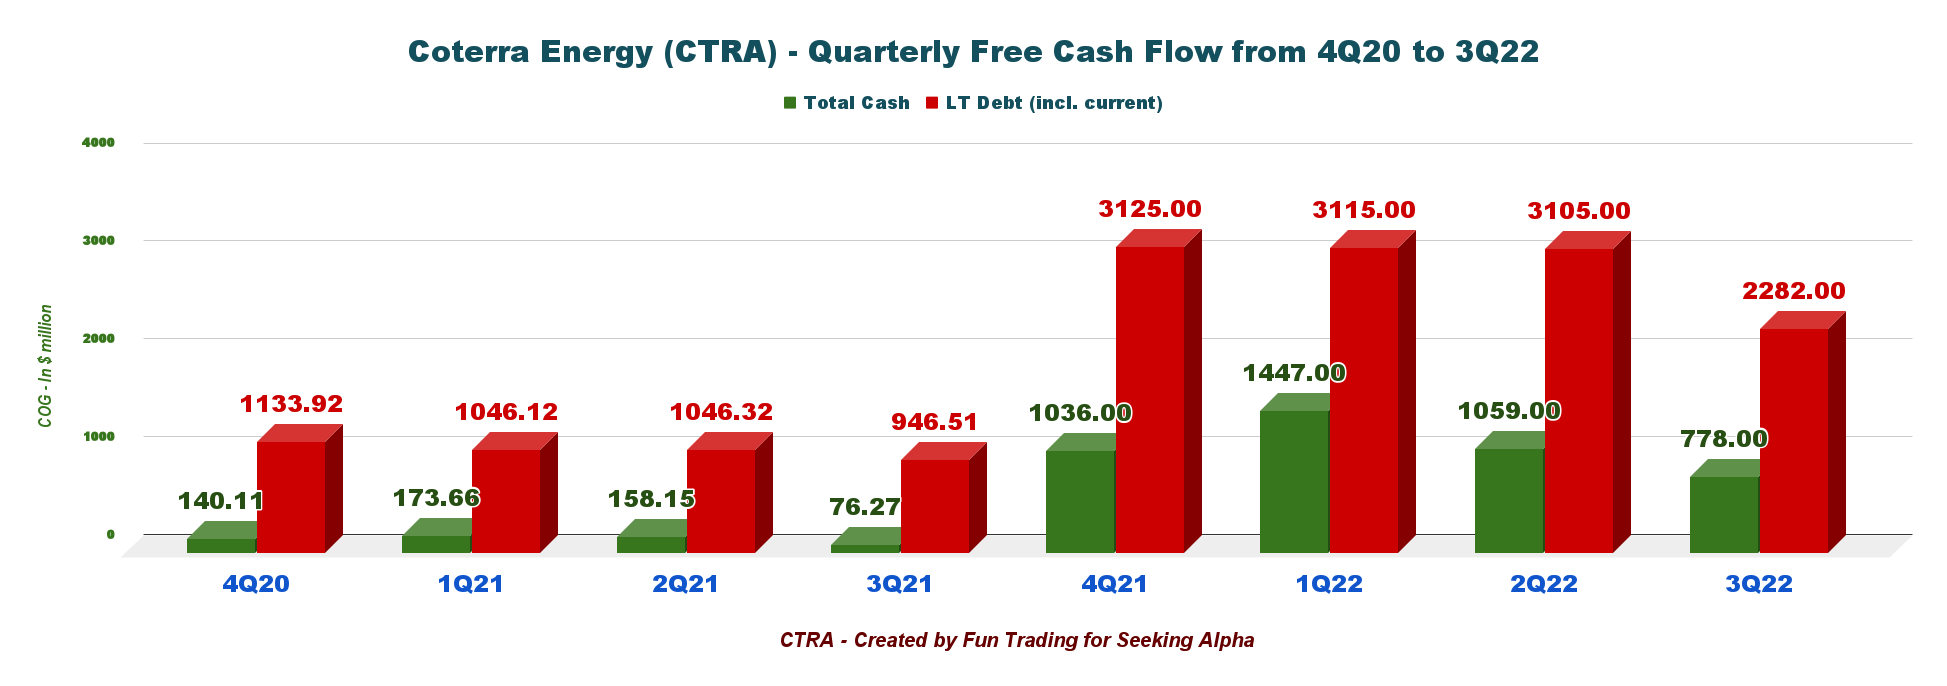
On September 30, 2022, Coterra Energy indicated a total debt of $2,282 million (including current) and cash on hand of $778 million.
Liquidity is $2.278 billion. The company is also indicating its 2022 Hedge summary below:
CTRA Balance sheet (CTRA Presentation)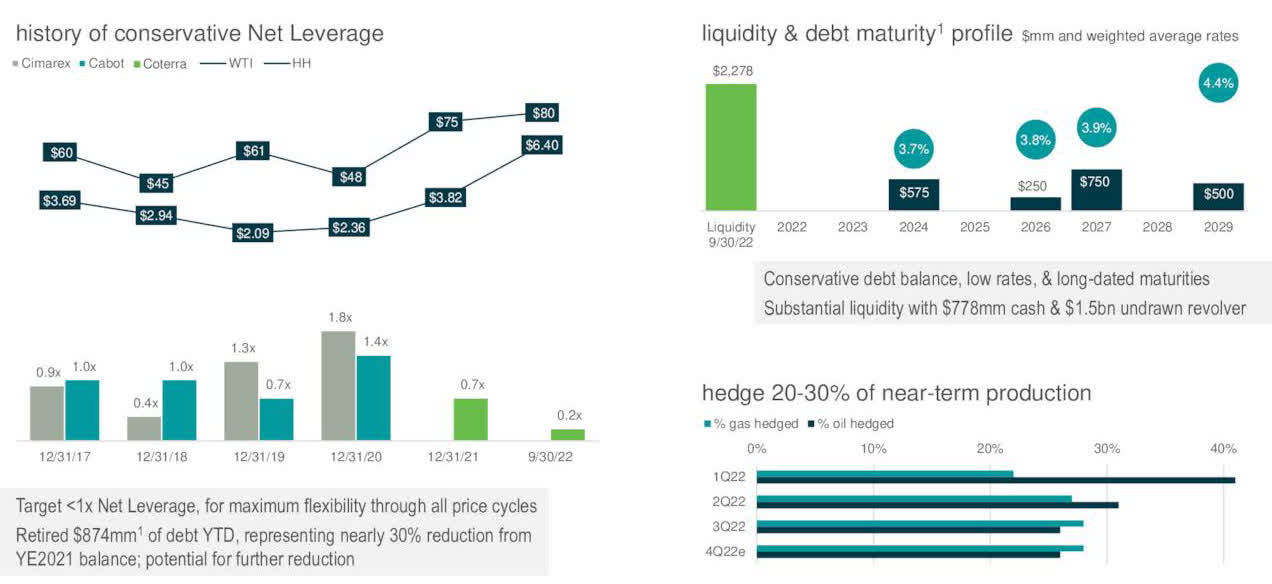
5 – 4Q22 and 2022 Outlook
For 2022, Coterra Energy forecasts 4Q22 production guidance of 615-635K Boepd with the production of 625-640 Boepd for 2022. Guidance was raised in November 2022.
CTRA Outlook for 2022 (CTRA Presentation)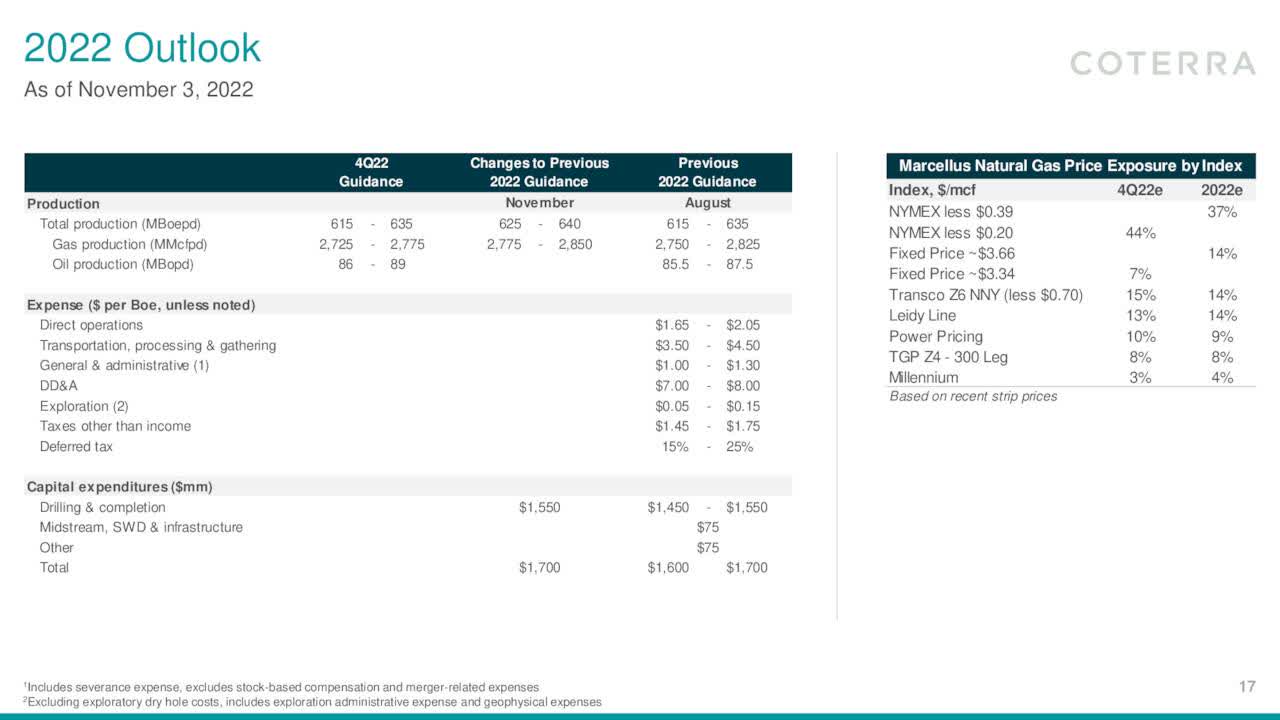
Technical Analysis Short Term and Commentary
CTRA TA Chart Short-term (Fun Trading StockCharts)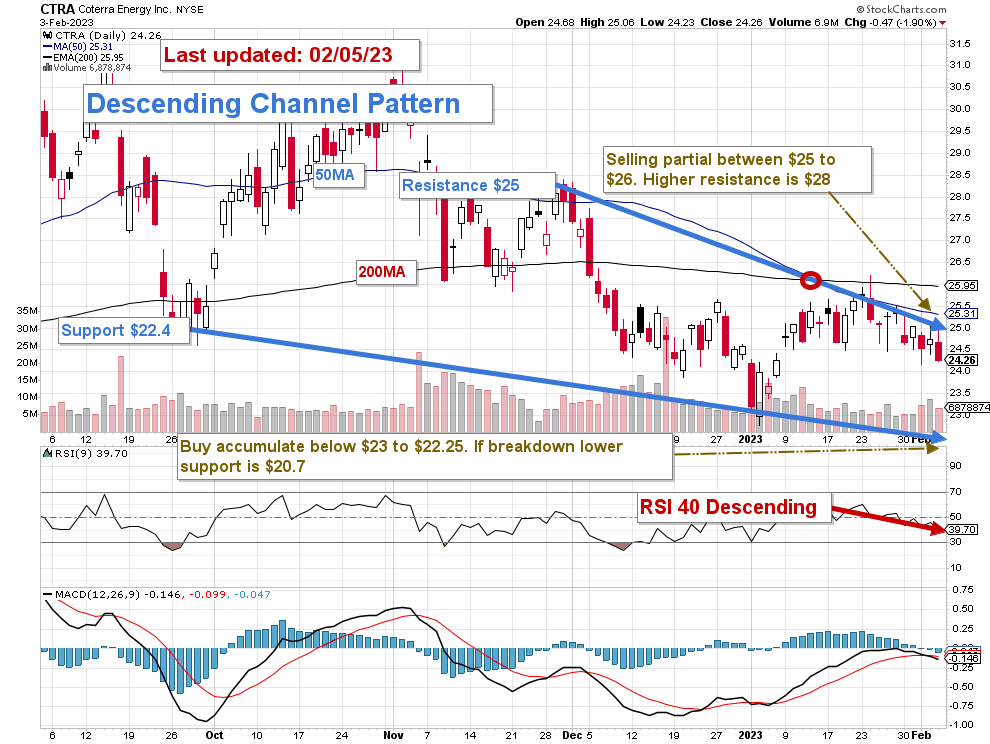
Note: The chart is adjusted for the dividend.
CTRA forms a descending wedge pattern with resistance at $25 and support at $22.4.
A falling wedge pattern is bullish, although it appears after a bearish trend. It signifies that bulls have lost their momentum, and bears have temporarily taken control over the price. As a result, the price starts to make new lower lows, but at a corrective pace.
The trading strategy is to sell about 30% to 40% of your position between $25 and $26, with potential higher support at $28. Conversely, I recommend buying and accumulating CTRA between $23 and $22.25, with possible lower support at around $20.7.
Warning: The TA chart must be updated frequently to be relevant. It is what I am doing in my stock tracker. The chart above has a possible validity of about a week. Remember, the TA chart is a tool only to help you adopt the right strategy. It is not a way to foresee the future. No one and nothing can.
Be the first to comment