

gustavofrazao/iStock via Getty Images
Here are two pictures, that sum up the cream of the crop in REIT investing over the past 5 years. The first shows the Top 10 REITs for Total Return, as of April 6. As you can see, BRT Apartments (NYSE:BRT) ranks #6 on this list. Surprised?
FactSet and Capital IQ Pro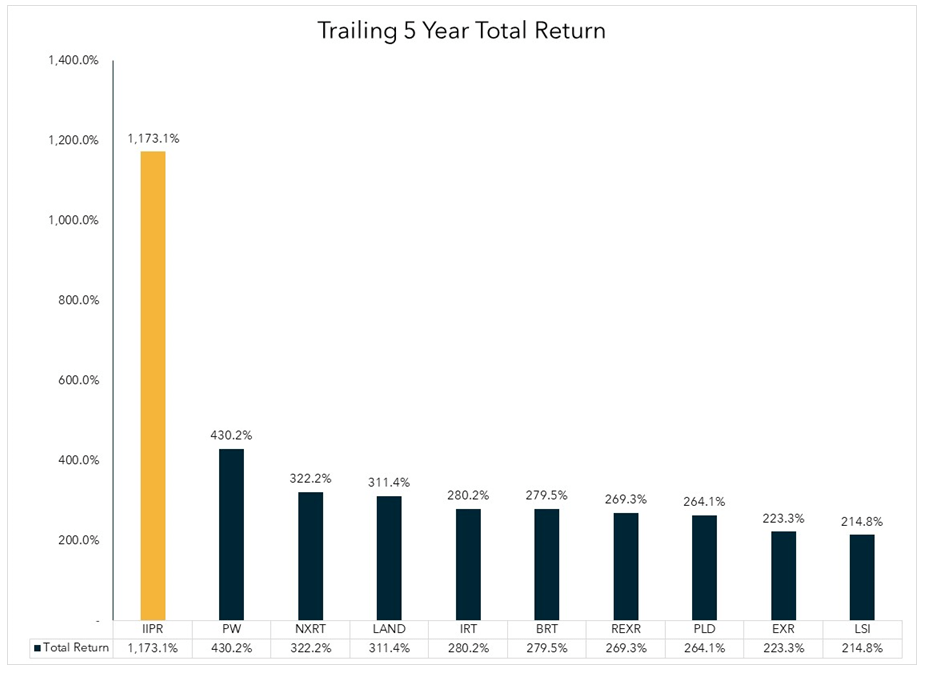
The second shows the Top 10 REITs for share price Gain, also as of April 6. BRT ranks #9 on this list.
FactSet and Capital IQ Pro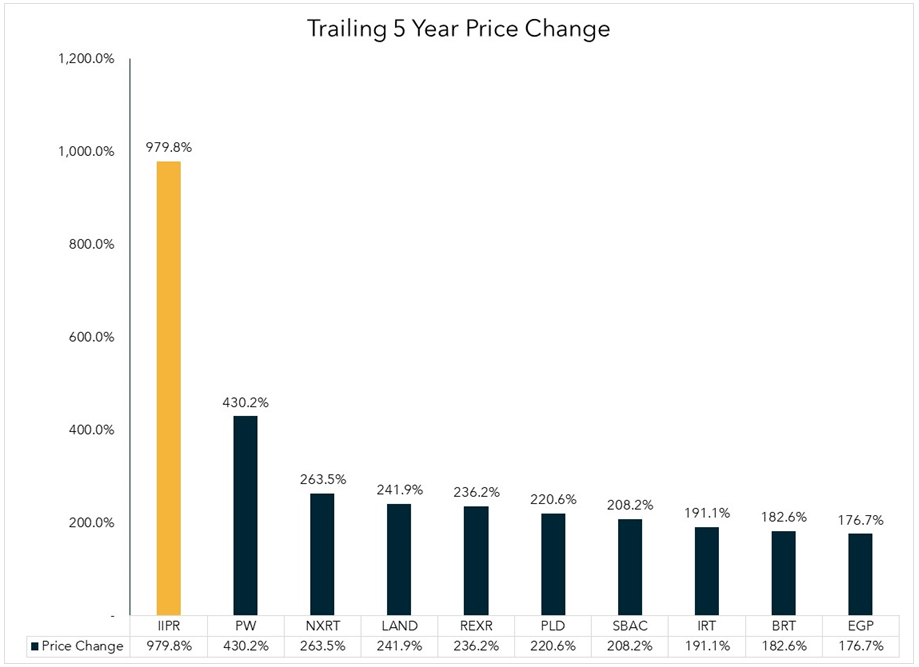
Over this same time period, the Vanguard Real Estate ETF (VNQ) has posted a trailing 5-year share price Gain of 9.66% per annum, which translates to 58.6%, when compounded over 5 years. BRT has more than tripled the market.
In this article, I take a closer look at the growth, balance sheet, dividend, and valuation metrics on this outperformer. I also reflect on my own decisions regarding this company, and invite the reader to share experiences also. The questions that center my thoughts are:
- When and where did I first hear about this stock?
- What prompted my decision to buy or not buy it?
- What prompted my decisions to sell or hold it?
- What patterns emerge that tell me more about myself as an investor?
- What changes do I need to make to be a better investor?
Meet the Company
BRT Apartments Corp.
BRT Apartments was founded in 1972, and is headquartered in Great Neck, New York. In 2011, the company shifted its focus to multifamily housing. What sets this company apart from other apartment REITs?
First is the geographic focus. From the start, BRT concentrated most of its assets in the Southeastern U.S. and Texas, with just a few outliers. As it happens, that is all Sunbelt territory.
BRT Apartments asset distribution (BRT Apartments website)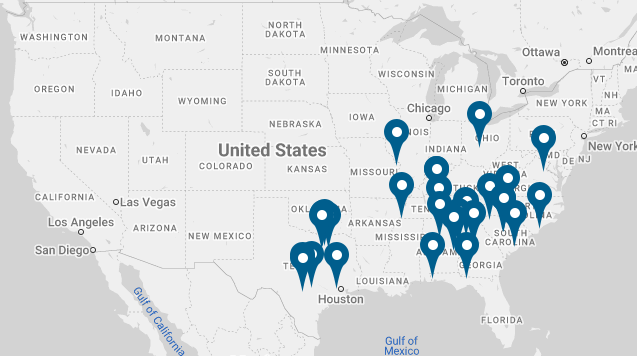
Here is a snapshot of some select Sunbelt markets, showing 6-year trailing employment growth, and projected population growth through 2025, compared to the U.S. and Gateway markets averages:
U.S. Bureau of Labor Statistics, Census Bureau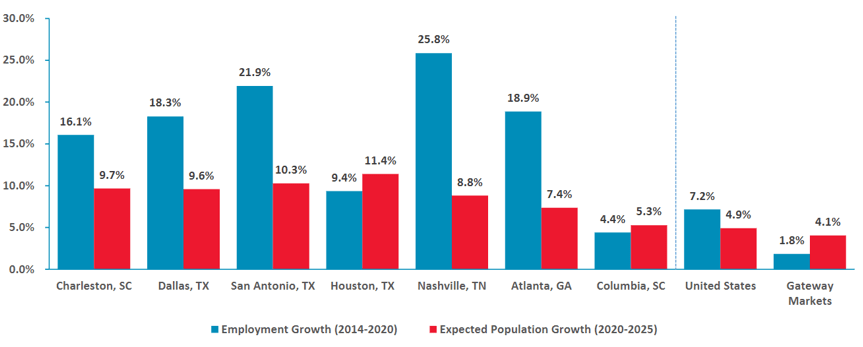
CEO Jeffrey Gould noted this on the latest earnings call:
Our geographic focus, primarily in the Southeast, has proven to be successful as we directly benefit from the historic migratory wave of jobs and families to these markets.
Second is their preference for joint ventures, rather than go-it-alone investments. According to the company’s website, they seek assets with 3 defining characteristics:
- Stabilized, undermanaged, or “value add” multi-family opportunities which would benefit from a capital improvement program and better hands-on management,
- Well located in areas showing positive indications of growth and which contain catalysts that promote employment and housing demand (e.g. universities, new commercial developments, airports, hospitals, and business centers), and
- In need of equity investment ranging from $2 million to $20 million.
They seek joint venture partners that:
- Have a significant track record and expertise in the specific market where the asset is located,
- Are capable of investing at least 20% of the equity required for the project (and can provide additional equity if needed),
- Have a relationship with the agency lenders and are able to (1) effectively navigate the agency loan application process, and (2) sign on any necessary guarantees, and
- Have management capabilities or a good association with high quality third-party management companies.
This is somewhat similar to the business model of fast-growing National Storage Affiliates (NSA) in the Storage REIT sector.
BRT owns interests in 33 properties in 11 states, totaling 9,273 units, with 10 of those properties (2,576 units) wholly-owned. They prefer to acquire class B or B+ properties and upgrade them, but will sometimes spring for a class A asset. In a typical deal, they will:
- Invest $2-20 million,
- Provide 65-80% of the equity required,
- Target 6-7% cash-on-cash yield from day one, and
- Target 10-20% IRR…
…and will take senior equity positions, if it will enhance returns and mitigate risk.
Latest quarterly returns
Interestingly, the company is currently losing money. Net income attributable to shareholders was (-$1.25) million for Q4 2021 (8 cents per share), but this is a major improvement YoY (year over year), compared to the company’s $3.3 million loss (19 cents per share) in Q4 2020.
FFO (funds from operations) for last quarter came in at $6.3 million ($0.35 per diluted share), compared to $4.96 million ($0.29 per diluted share), a 27% increase YoY.
For the full year 2021, net income attributable to shareholders was $29.1 million ($1.62 per diluted share) compared to a (-$19.86) million loss (-$1.16 per diluted share) in 2020.
FFO for 2021 was $17.43 million ($0.97 per diluted share) compared to $17 million or ($0.99 per diluted share) YoY. Contributing factors to these FFO figures included higher operating margins at same-store properties and the effect of BRT’s acquisition of their partners’ interest in several joint ventures.
Average rents in the fourth quarter 2021 were $1,233 per month, up 13.3% compared to the 2020 quarter. For leases signed in Q4 2021, BRT earned very respectable spreads on new leases at 10.7%, and renewal spreads of 7.9%, for a blended rate of 9.3%.
Same-store NOI in Q4 2021 increased 12.3% YoY, on same-store revenue growth of 9.2%, and same-store expense growth of 5.3%. Full-year same-store NOI increased 8.2% YoY, on 7% revenue growth and 5.6% expense growth.
The company opportunistically sells its interest in underperforming properties, and buys out its partners in high-performing assets. Average occupancy was 96.4% at year’s end 2021, up 1.9% YoY.
Growth metrics
This company’s growth metrics are a mess. It has grown FFO at a spectacular rate, but cash flow has been hit hard by the pandemic and has yet to recover. Meanwhile FFF (funds from financing) has been negative for 3 of the past 4 years, and more than wiped out FFO. But the market cap has grown at a 3-year CAGR of 15.2%, despite the pandemic’s gut punch.
| Metric | 2018 | 2019 | 2020 | 2021 | 3-year CAGR |
| FFO (millions) | $3.56 | $12.0 | $17.0 | $17.4 | — |
| FFO Growth % | — | 237.1 | 41.7 | 2.4 | 69.71 |
| TCFO (millions) | $7.7 | $8.6 | (-$1.7) | (-$0.6) | — |
| TCFO Growth % | — | 11.7 | NA | NA | NA |
| FFF (millions) | (-38.0) | (-$30.9) | (-$6.8) | $32.9 | — |
| FFF Growth % | — | NA | NA | NA | NA |
| Market Cap (billions) | $0.17 | $0.19 | $0.29 | $0.26 | — |
| Market Cap Growth % | — | 11.8 | 52.6 | (-10.3) | 15.21 |
Source: TD Ameritrade, MacroTrends.net, and author’s calculations
Growth has certainly been uneven, but BRT’s returns are hard to argue with. From a closing price of $8.44 on April 6, 2017, share price has risen to $23.85 on April 6 of this year. That’s a gain of 182.6%. Here is a chart showing BRT’s 198% returns since January 2017, compared to 88.0% for the S&P 500. Meanwhile, the company remains pretty small, with a market cap of just $434 million.
BRT Apartments investor presentation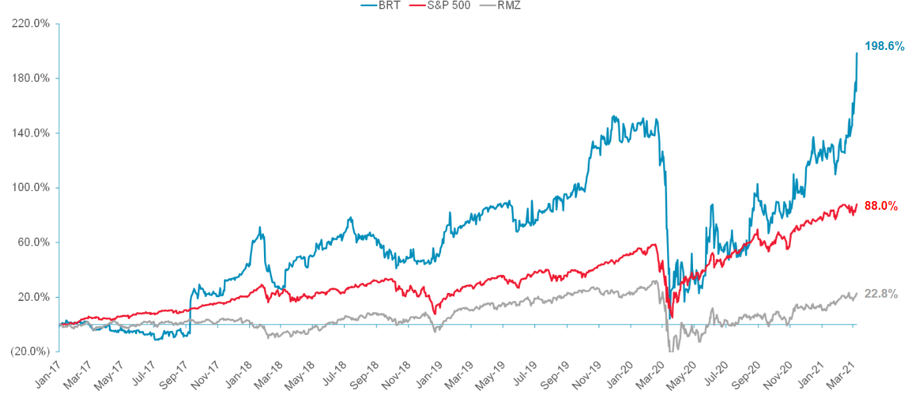
Balance sheet metrics
Judged by the standards of most equity REITs, this company’s balance sheet looks bad, especially the Debt/EBITDA of 41.5. Yikes!
However, since this company is more interested in financing joint ventures than owning properties outright (at least for now), this kind of leverage may make sense. Perhaps it is not fair to judge them by the standards of an ordinary equity REIT. Your thoughts on this are welcome in the comments section.
| Company | Liquidity Ratio | Debt Ratio | Debt/EBITDA | Bond Rating |
| BRT | 1.79 | 38% | 41.5 | — |
Source: Hoya Capital Income Builder, TD Ameritrade, author’s calculations
Aggregate mortgage debt for their 10 wholly owned properties, combined with BRT’s share of their joint ventures, totaled $580 million, at a weighted average interest rate of 3.92%, with a weighted average remaining term of 8.2 years.
Debt to enterprise value at year’s end was a staggering 61%, but this was an improvement from 75% at the close of 2020!
When asked to specify the company’s target leverage, Gould offered this somewhat evasive answer on the March 15 earnings call:
We’ve heard from investors that it’s a bit of a concern and it’s also something that we watch carefully. We do have one other decent mortgage debt that we’re considering paying off. But generally speaking, I would say, we’re very focused on our loan-to-enterprise value and loans and mortgages-to-enterprise value.
It was the only question asked.
Dividend metrics
BRT excels on dividends, and this is probably why the company is so popular with investors. The Yield is higher than average, especially for an apartment REIT, and so is the dividend growth rate, which is a rare combination. Shares bought on April 6, 2017 are yielding 10.9% on cost.
Remarkably, BRT never cut or delayed its dividend during the pandemic, and raised its quarterly dividend in the Fall of 2021 to its current level of $0.23.
| Company | Div. Yield | Div. Growth | Div. Score | Payout Ratio | Safety |
| BRT | 3.92% | 4.77% | 4.51 | 75% | D+ |
Source: Hoya Capital Income Builder, Seeking Alpha Premium, and author’s calculations
At the current dividend growth rate, shares bought today would yield 4.51% three years from now.
Valuation metrics
Looked at as a value play, the price is reasonable, falling below both the Apartment REIT average and the overall REIT average. This is especially noteworthy, given the company’s growth potential.
| Company | Div. Score | Price/FFO | Premium to NAV |
| BRT | 4.51% | 24.2 | (-16.3)% |
Source: Hoya Capital Income Builder and author’s calculations
What could go wrong?
BRT’s concentration of assets in the Southeastern U.S. and Texas creates risk as well as reward, in case that area takes an economic downturn in the future.
Joint venture partners may have competing interests, may fail to carry out their end of the bargain, may develop friction with BRT, and could go bankrupt.
Ironically, the better a joint venture performs, the greater the risk that profits over and above a negotiated threshold will be allocated disproportionately in favor of the joint venture partner.
Increases in taxes, utilities, and insurance premiums can affect the bottom line. BRT’s value-add strategy means the company has construction costs and time frames that may be overrun or delayed.
BRT is a small fish in a big pond. Most apartment REITs have greater financial resources, making it tougher for BRT to compete for acquisitions.
My history with this company
When I made the fateful decision to invest my life savings in a basket of REITs and REIT ETFs in March, 2019, I allocated 2.5% to BRT, because I liked its growth numbers. I did not yet understand the importance of balance sheet quality or company size.
In a helpful article published April 29, 2019 on Seeking Alpha, Jussi Askola of High Yield Landlord named this company as a major offender in “overleveraging the balance sheet.” Influenced by this, about a month later I liquidated my position in BRT at a loss of about 7% and bought STORE Capital (STOR) instead.
Then on January 7, 2020, I read an article by Hoya Capital, showing research indicating that small cap REITs on average generate the worst returns. After that, I never considered tiny BRT again.
I don’t blame Jussi or Hoya. The decision was mine alone. If I knew then what I know now about company size and leverage, I would have downsized my position by half or so, rather than liquidating.
Were you on board for all or any part of this 5-year rocket ride? Why or why not?
Investor’s bottom line
If you have a taste for risk, this is a pretty interesting company. Apartment REITs are among the 7 sectors most likely to outperform this year, and this small-cap firm is well-positioned, with an intriguing track record.
I rate the company a cautious Buy, with an undersized allocation. The other Seeking Alpha authors tend to agree, along with the Wall Street analysts, but the Quant Ratings show the company as a Hold, and so does The Street.
Seeking Alpha Premium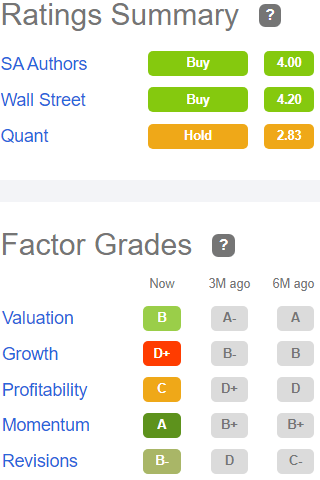
TipRanks rates BRT a strong Outperform. B. Riley and EF Hutton both rate the company a Buy, with identical $29 price targets, implying 24% upside.
Be the first to comment