

Jose Luis Pelaez Inc
Everyone says they want to “be greedy when others are fearful,” but when blue chips are crashing, that’s easier said than done.
In bear markets like this one, volatility can be so extreme that even dividend aristocrats can plunge 20% to 25% in a single day.
Amazon (NASDAQ:AMZN) is one of my highest conviction recommendations of all time, and my third largest holding in my retirement portfolio.
And during a rather bloody tech earnings week, Amazon disappointed Wall Street in a rather spectacular fashion.
Ycharts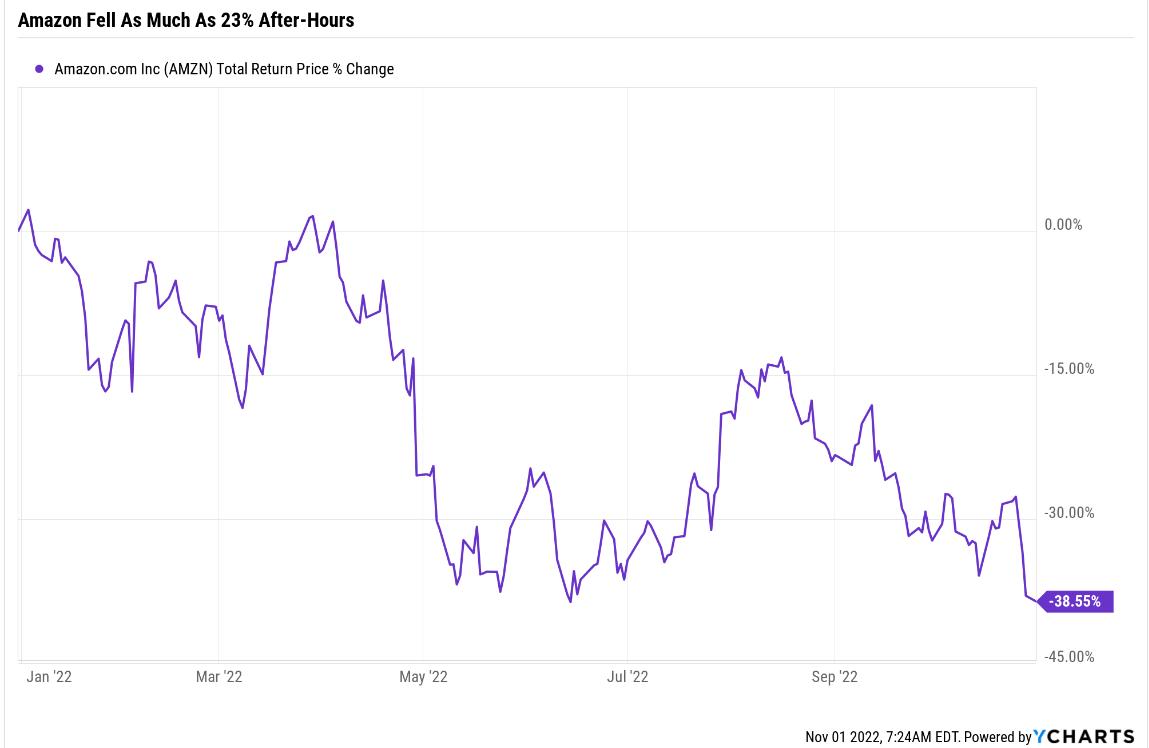
Was all of the crash a knee-jerk reaction? No, some of it was justified. But most of it was an overreaction which is why I backed up the truck on Amazon, buying it no less than four times after its earnings flash crash.
Interactive Brokers 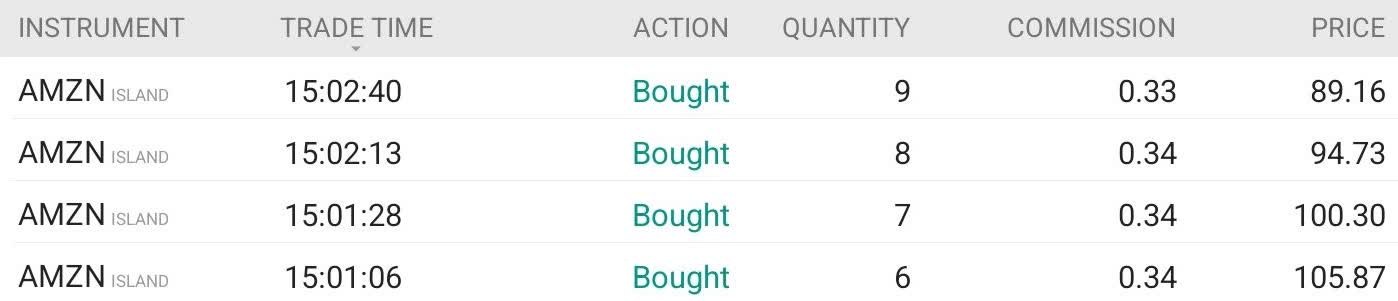
- Amazon rallied 22% within 24 hours of its $87 low
I always set limits on Amazon right before earnings come out, at -5%, -10%, -15%, -20%, -25%, and -30%, just in case of a post-earnings flash crash.
Let me show you the three reasons why Amazon’s recent crash is such a great opportunity for long-term investors and could help you achieve your rich retirement dreams.
Reason One: A Major Overreaction To A Bad Quarter
Ycharts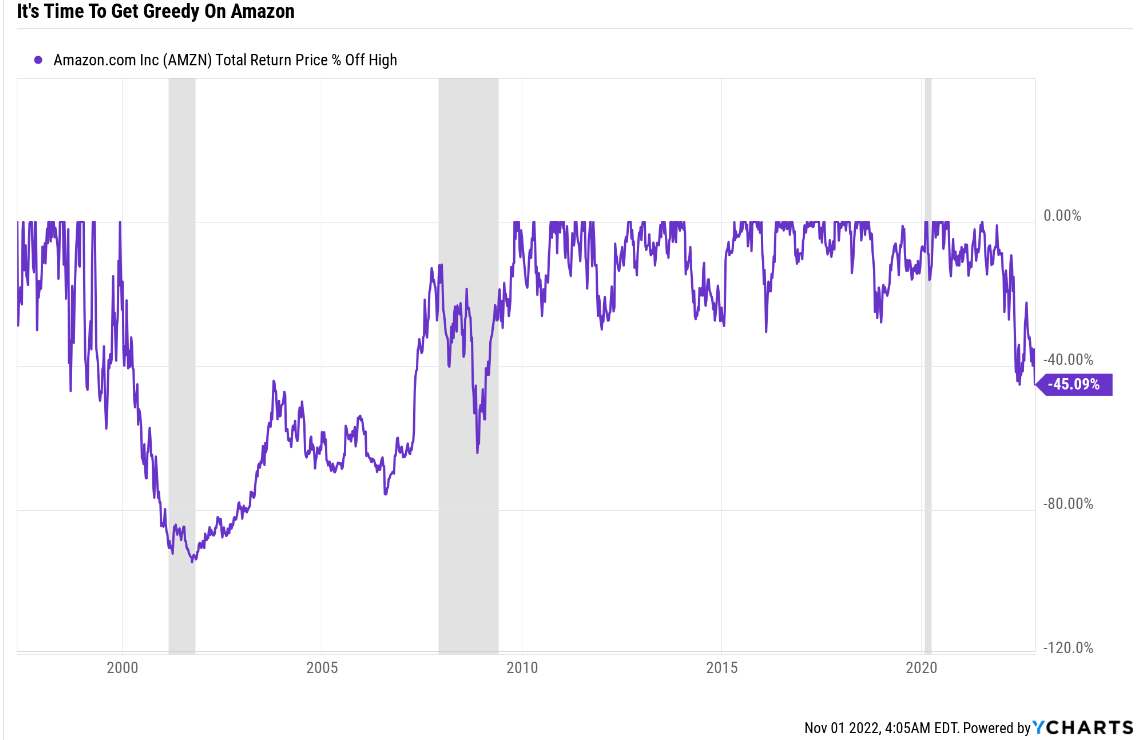
Amazon has now fallen into the worst bear market since the Great Recession and the 3rd worst in its history.
The Last Pre-Pandemic Time Amazon Was This Undervalued
(Source: FAST Graphs, FactSet)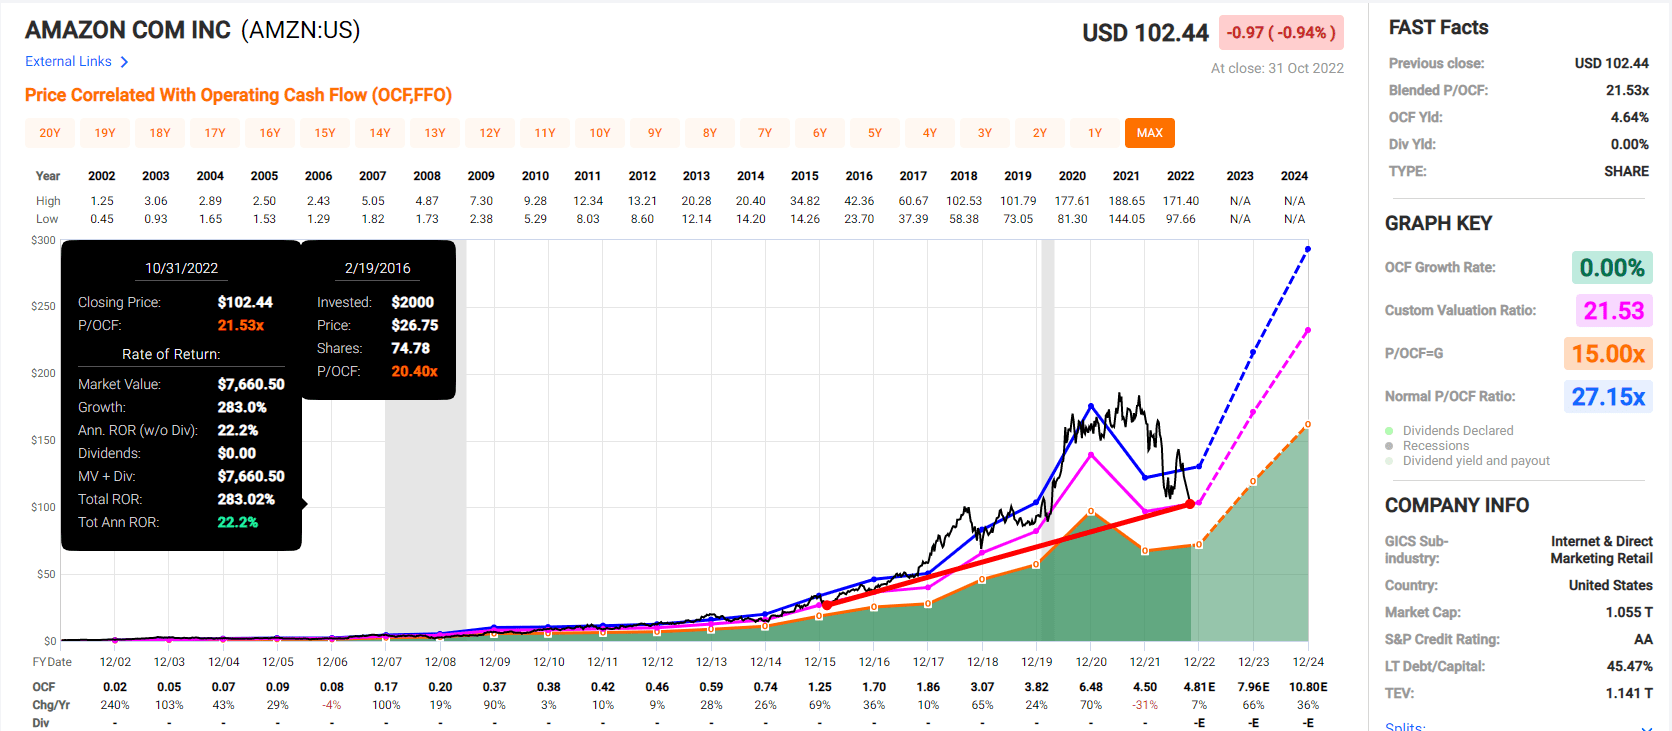
Amazon is trading at the lowest valuation in six years and even measured from bear market low to bear market low, it’s delivered 22% CAGR returns (nearly 4X) over the last six years.
Why Wall Street Freaked Out Over Amazon’s Earnings
(Source: earnings presentation)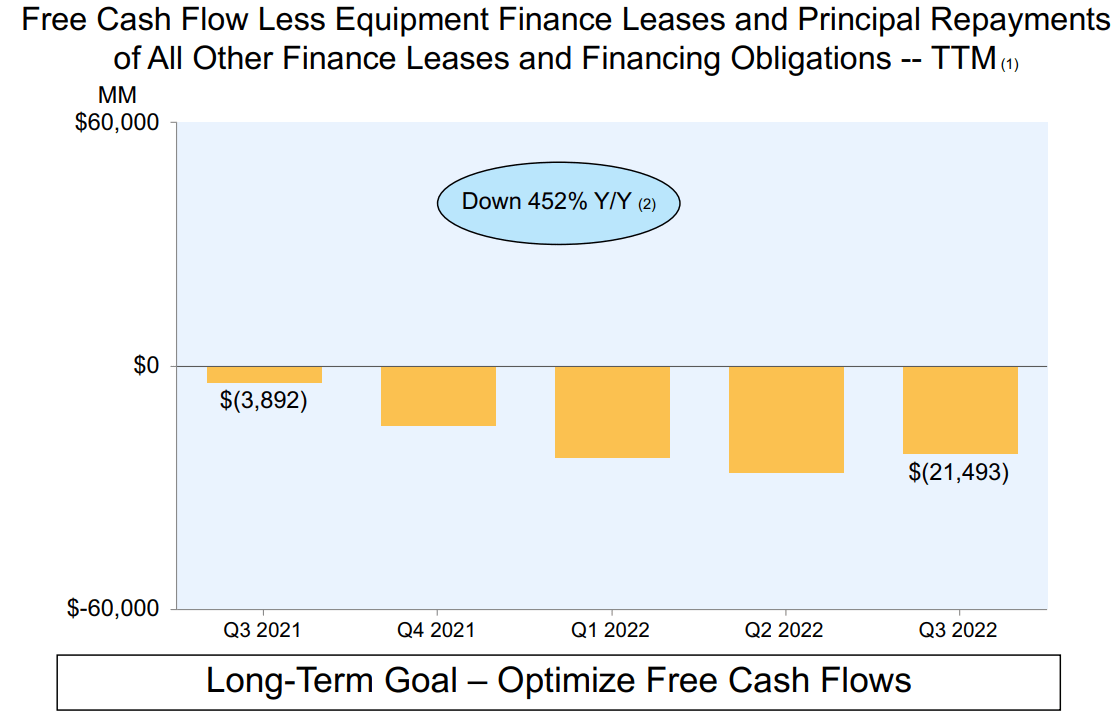
Amazon’s trailing free cash flow has collapsed due to heavy growth spending running into currency effects and a weaker consumer.
Amazon Growth Spending Consensus Forecast
| Year | SG&A (Selling, General, Administrative) | R&D | Capex | Total Growth Spending | Sales | Growth Spending/Sales |
| 2021 | $41,374 | $49,407 | $55,396 | $146,177 | $469,822 | 31.11% |
| 2022 | $50,527 | $67,210 | $60,296 | $178,033 | $512,605 | 34.73% |
| 2023 | $55,194 | $73,834 | $61,020 | $190,048 | $570,728 | 33.30% |
| 2024 | $61,718 | $82,818 | $62,160 | $206,696 | $653,804 | 31.61% |
| 2025 | $63,365 | $84,447 | $61,462 | $209,274 | $728,582 | 28.72% |
| 2026 | $70,147 | $95,620 | $58,446 | $224,213 | $826,987 | 27.11% |
| 2027 | $75,964 | $104,900 | $58,765 | $239,629 | $923,998 | 25.93% |
| Annualized Growth | 14.26% | 18.79% | 2.63% | 12.24% | 11.93% | -2.99% |
| Total Growth Spending 2022-2027 | $376,915 | $508,829 | $362,149 | $1,247,893 | $4,216,704 | -6.0% |
(Source: FactSet Research Terminal)
Amazon’s growth spending in 2021 was $146 billion, and that’s expected to keep growing at 12% annually, from 31% of sales to 26% in 2027.
Analysts expect AMZN’s total growth spending to be approximately $1.25 trillion over the next six years.
- more than the US government plans to spend on infrastructure over the next decade
For the full year 2022, we expect to incur approximately $60 billion in capital investments, which is broadly in line with what we spent in 2021. This represents an estimated reduction in fulfillment and transportation capital investments of approximately $10 billion compared to last year, as we’ve continued to moderate our build expectations to better align with demand.” – CFO Q3 conference call (emphasis added)
Analysts expect AMZN’s growth capex spending to remain relatively stable through 2027, with growth spending focused on SG&A and R&D.
- $105 billion R&D spending consensus in 2027
- by far the most of any company in history
- more than 2X more than the US government spends on R&D
Amazon’s sales guidance for Q4 was +2% to +8%, the slowest Christmas season in history.
This has some investors worried that Amazon is going the way of Meta (META), overspending and wiping out its free cash flow while its core business growth slows to a crawl.
|
Previous Estimates |
Current Estimates |
Quarterly Change |
|||
| 2022 OCF | 2023 OCF | 2022 OCF | 2023 OCF | 2022 OCF | 2023 OCF |
| $6.11 | $9.20 | $4.81 | $7.96 | -27.03% | -15.58% |
(Source: FactSet Terminal)
Amazon’s 2022 and 2023 cash flow estimates fell significantly after its miss, after management updated analysts on its outlook for the rest of the year and plans to adapt to its challenges.
Why Wall Street Is Overreacting To Amazon’s Earnings
(Source: earnings presentation)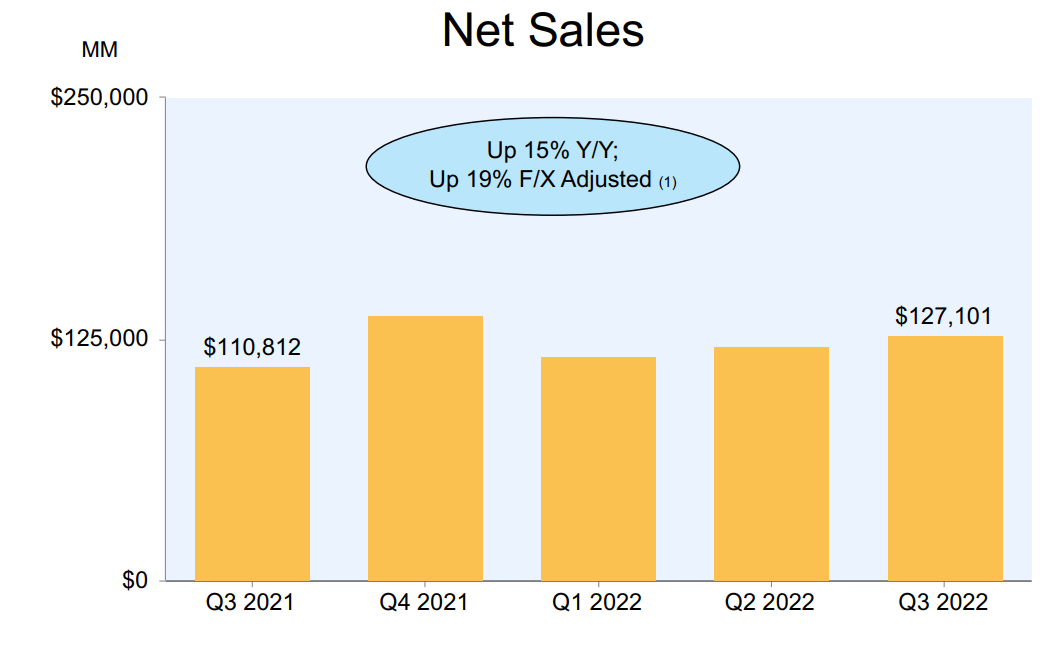
Adjusted for currency effects, which were -4.6% at the company level, sales were up 19% YOY in Q3.
(Source: earnings presentation)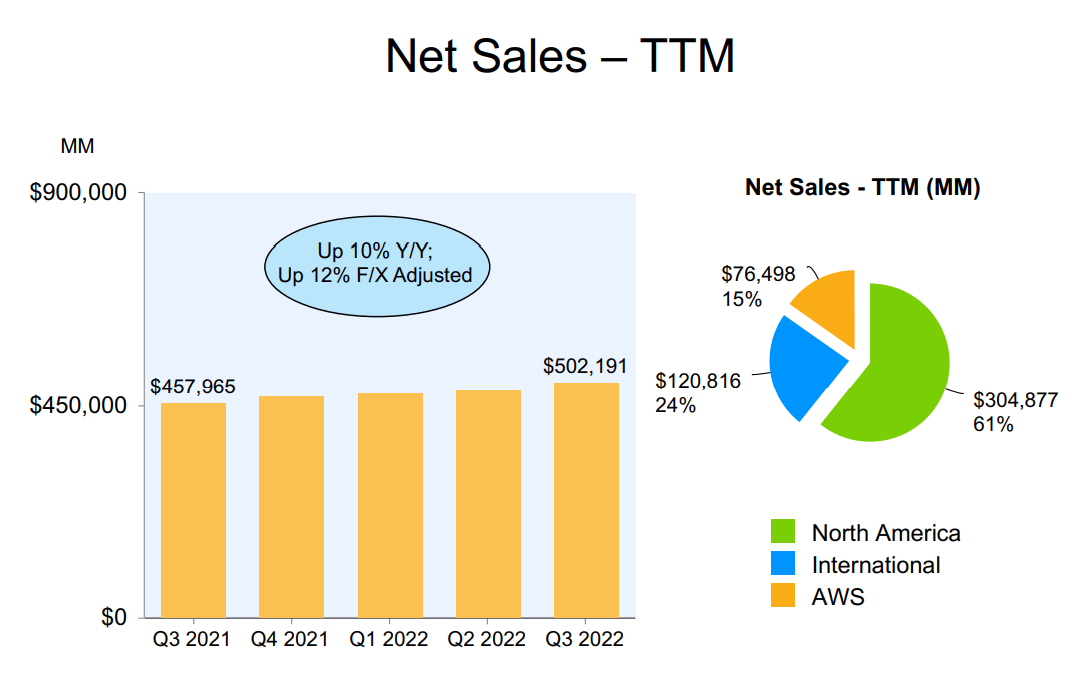
Over the last 12 months, Amazon’s constant currency sales were up 12%, the same rate as analysts expect long-term. In constant currency, trailing 12-month sales were:
- North America: +20%
- International +12%
- AWS +28%
- Advertising +27%
- Online stores: +7%
- Physical stores: +10%
- 3rd party: +18%
- subscriptions (Prime): +9%
- Overall: +19%
Amazon Medium-Term Growth Consensus Forecast
| Year | Sales | Free Cash Flow | EBITDA | EBIT (Operating Income) | Net Income |
| 2021 | $469,822 | -$9,069 | $71,994 | $24,879 | $33,364 |
| 2022 | $512,605 | -$14,236 | $71,544 | $12,881 | $107 |
| 2023 | $570,728 | $21,376 | $83,649 | $23,490 | $19,873 |
| 2024 | $653,804 | $48,635 | $107,316 | $42,469 | $34,157 |
| 2025 | $728,582 | $66,560 | $127,806 | $59,015 | $45,390 |
| 2026 | $826,987 | $106,508 | $167,105 | $81,651 | $66,166 |
| 2027 | $923,998 | $137,490 | $199,189 | $106,158 | $86,408 |
| Annualized Growth 2021-2027 | 11.93% | 59.25% | 18.48% | 27.36% | 17.19% |
| Cumulative 2022-2027 | $4,216,704 | $366,333 | $756,609 | $325,664 | $252,101 |
(Source: FactSet Research Terminal)
Amazon is the 3rd largest company on earth in terms of sales, second only to Saudi Aramco and Walmart (WMT).
- By 2028, Amazon could become the first trillion sales company in history
Yet it’s growing at 12%, and its bottom line is expected to grow much faster, thanks to continued margin expansion.
- Including 59% CAGR growth in free cash flow in the coming years
Amazon Profit Margin Consensus Forecast
| Year | FCF Margin | EBITDA Margin | EBIT (Operating) Margin | Net Margin |
| 2021 | -1.9% | 15.3% | 5.3% | 7.1% |
| 2022 | -2.8% | 14.0% | 2.5% | 0.0% |
| 2023 | 3.7% | 14.7% | 4.1% | 3.5% |
| 2024 | 7.4% | 16.4% | 6.5% | 5.2% |
| 2025 | 9.1% | 17.5% | 8.1% | 6.2% |
| 2026 | 12.9% | 20.2% | 9.9% | 8.0% |
| 2027 | 14.9% | 21.6% | 11.5% | 9.4% |
| Annualized Growth 2022-2027 | 41.18% | 5.85% | 13.78% | 4.69% |
(Source: FactSet Research Terminal)
Amazon is one of the world’s fastest-growing companies, despite its massive size.
Amazon isn’t some non-profitable speculative growth stock with no clear path to profitability.
It has a very clear path to monster profits, with a net income north of $100 billion in 2028.
(Source: FactSet Research Terminal)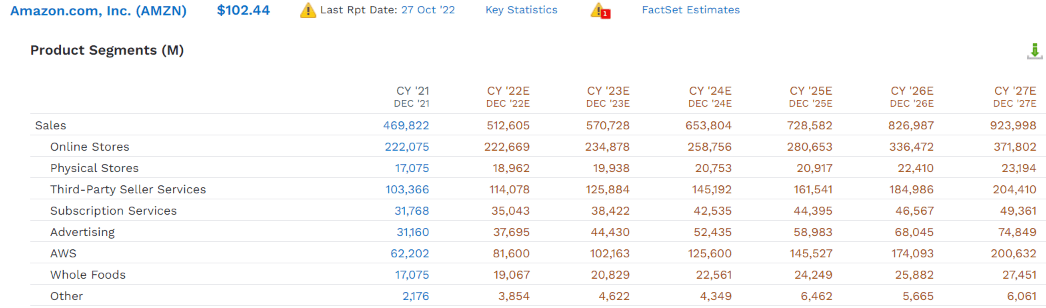
Every part of Amazon’s empire is expected to grow steadily through 2027, even Whole Foods. From 2021 through 2027, here are Amazon’s business annual growth consensus forecasts.
- AWS: 22%
- Other: 20%
- Advertising: 16%
- 3rd party: 12%
- online stores: 9%
- Whole Foods: 9%
- subscription (Prime): 7%
- physical stores: 5%
(Source: FactSet Research Terminal)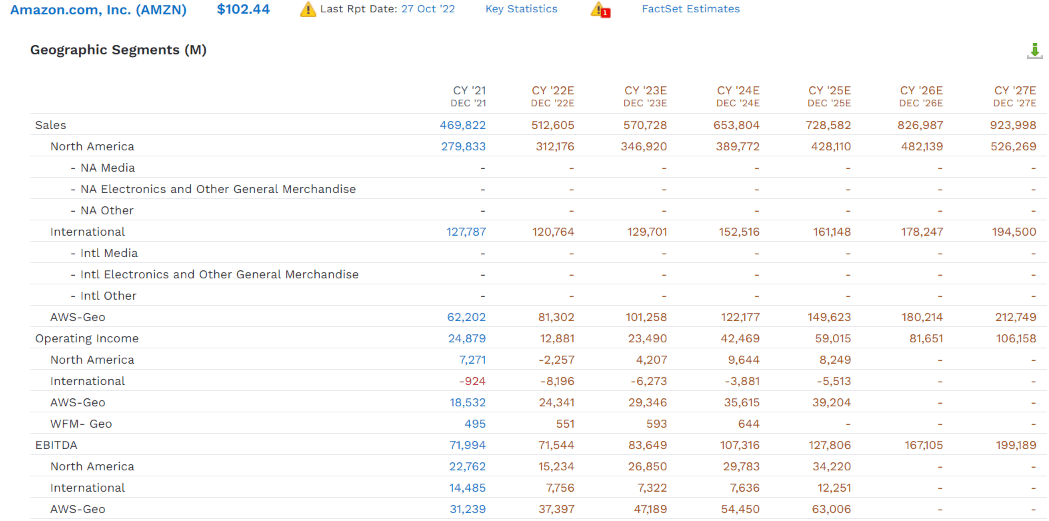
Here is the consensus 2025 operating margins for Amazon’s businesses:
- Overall: 8.1%
- North America: 1.9%
- International: -3.4%
- AWS: 26%
AWS is the cash cow for Amazon, with 26% consensus 2025 operating margins and 42% EBITDA margins.
Piper Jaffray estimates that advertising margins are about 75% and that part of the business is expected to grow at 15% through 2027, 25% faster than the company as a whole.
- economies of scale are expected to get international to profitability at some point
- while AWS and advertising will generate close to $150 billion in free cash flow by 2027
This brings us to the big concern some investors have about Amazon’s big spending in 2022. Can its balance sheet handle a -$22 billion FCF year?
Amazon’s Balance Sheet Is A Fortress
| Rating Agency | Credit Rating | 30-Year Default/Bankruptcy Risk | Chance of Losing 100% Of Your Investment 1 In |
| S&P | AA Stable Outlook | 0.5% | 196.1 |
| Fitch | AA- Stable Outlook | 0.55% | 181.8 |
| Moody’s | A1 (A+ equivalent) Stable Outlook | 0.60% | 166.7 |
| Consensus | AA- Stable Outlook | 0.55% | 180.7 |
(Sources: S&P, Fitch, Moody’s)
Amazon’s balance sheet is AA-rated with a 0.55% fundamental risk of bankruptcy over the next 30 years.
(Source: FactSet Research Terminal)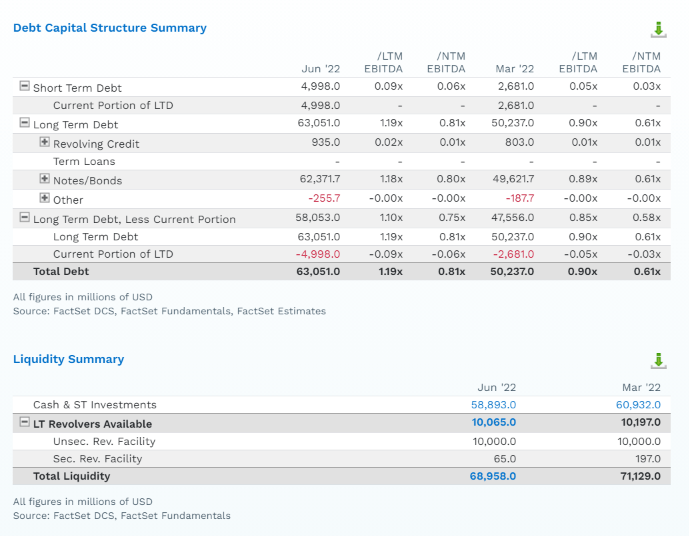
Amazon’s net debt is just $4 billion and its debt/EBITDA is 1.2 vs 3.0 or less safe, according to rating agencies.
Next year leverage is expected to fall to just 0.8.
In total, Amazon has $69 billion in liquidity to help fund its aggressive though toned-down growth efforts in 2023.
(Source: FactSet Research Terminal)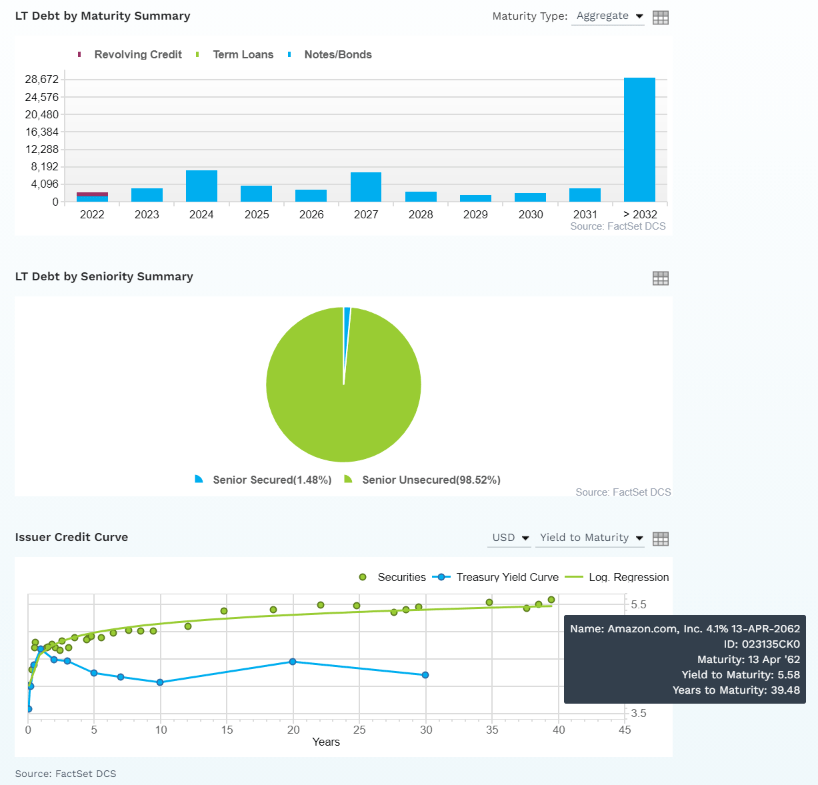
Amazon’s debt maturities are well-staggered, and it should have no trouble-refinancing maturing debt in the recession.
99% of its debt is long-term fixed-rate unsecured bonds, for maximum financial flexibility.
The bond market is so confident in Amazon’s growth plans that they are willing to lend to Amazon for 40 years at a reasonable 5.6% (4.1% originally).
- lower borrowing costs than the US treasury
- Amazon’s average borrowing cost: 1.95%
- -0.32% inflation-adjusted borrowing costs
Credit Default Swaps: The Bond Market’s Real-Time Fundamental Risk-Assessment
(Source: FactSet Research Terminal)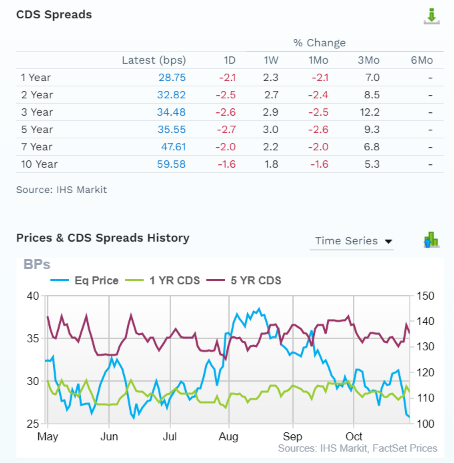
Credit default swaps are the insurance policies bond investors take out against potential default, and you can see that Amazon’s 5-year default risk has been relatively stable at around 0.35% for the last six months.
The stock price may have crashed, but bond investors aren’t worried about AMZN’s fundamentals.
- neither are rating agencies nor analysts
In other words, Amazon’s hyper-growth thesis remains intact, its balance sheet is still a fortress, and it remains one of the highest-quality world-beater blue chips on earth.
Why Amazon Could One Day Become A Great Dividend Growth Blue-Chip
(Source: FactSet Research Terminal)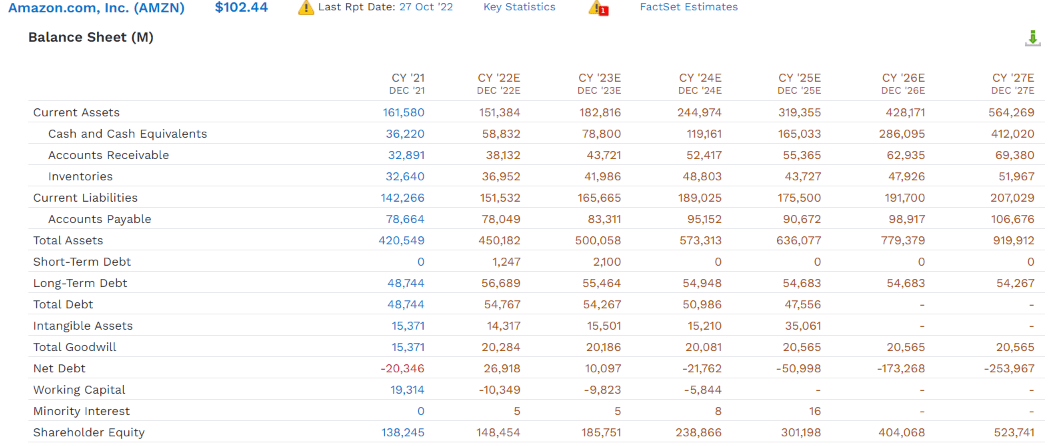
Amazon is expected to have $412 billion in cash on the balance sheet, and $253 billion in net cash by 2027.
- and be generating $137 billion in annual free cash flow
If Amazon grows anything close to expected eventually it could start paying a dividend and buying back shares in the largest capital return in human history.
- more than even Apple (AAPL)
Reasons I Just Bought Amazon And So Should You
| Metric | Amazon |
| Quality | 99% 13/13 Quality Ultra SWAN (Sleep Well At Night) Company |
| Risk Rating | Low Risk |
| DK Master List Quality Ranking (Out Of 500 Companies) | 15 |
| Quality Percentile | 97% |
| Balance Sheet Safety Score | 100% |
| S&P Credit Rating | AA stable |
| 30-Year Bankruptcy Risk | 0.55% |
| LT S&P Risk-Management Global Percentile |
68% Above-Average, Low Risk |
| Fair Value | $187.34 |
| Current Price | $102.44 |
| Discount To Fair Value | 45% |
| DK Rating |
Potential Ultra Value Buy |
| P/Operating Cash Flow | 13.6 |
| Cash-Adjusted PE | 13.9 |
| Growth Priced In | 10.8% |
| Historical P/OCF | 25 to 27 |
| LT Growth Consensus/Management Guidance | 19.2% |
| PEG Ratio | 0.72 (Hyper-Growth At An Attractive Price) |
| 5-year consensus total return potential |
32% to 35% CAGR |
| Base Case 5-year consensus return potential |
33% CAGR (7X the S&P 500) |
| Consensus 12-month total return forecast | 35% |
| Fundamentally Justified 12-Month Return Potential | 83% |
| LT Consensus Total Return Potential | 19.2% |
| Inflation-Adjusted Consensus LT Return Potential | 16.9% |
| Consensus 10-Year Inflation-Adjusted Total Return Potential (Ignoring Valuation) | 4.77 |
| LT Risk-Adjusted Expected Return | 13.37% |
| LT Risk-And Inflation-Adjusted Return Potential | 11.08% |
| Conservative Years To Double | 6.50 Vs 15.2 S&P |
(Source: Dividend Kings Zen Research Terminal)
Amazon is trading at just 13.9X cash-adjusted earnings, a PEG of 0.72.
It’s 45% historically undervalued, and analysts expect a 35% return within 12 months. But it’s so undervalued and expected to grow so quickly next year, that an 88% gain within 12 months would be justified by fundamentals.
- Amazon is priced for 11% growth but is expected to grow almost 2X faster
Amazon 2024 Consensus Total Return Potential
(Source: FAST Graphs, FactSet)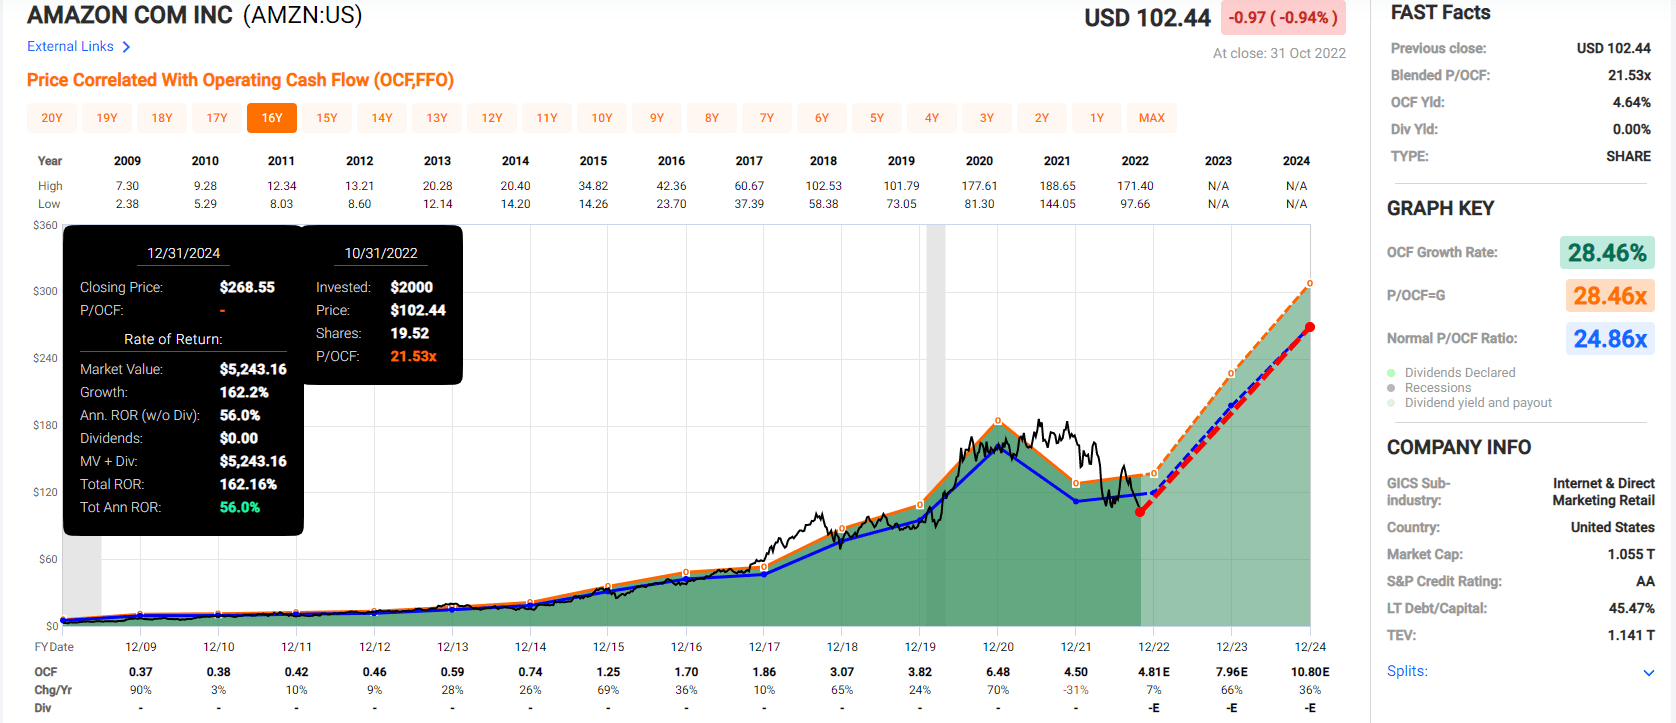
If Amazon grows as expected and returns to the low end of market-determined historical fair value by 2024, you could see a 162% return, or 54% annually.
- about 5X more than the S&P 500 consensus
Amazon 2027 Consensus Total Return Potential
(Source: FAST Graphs, FactSet)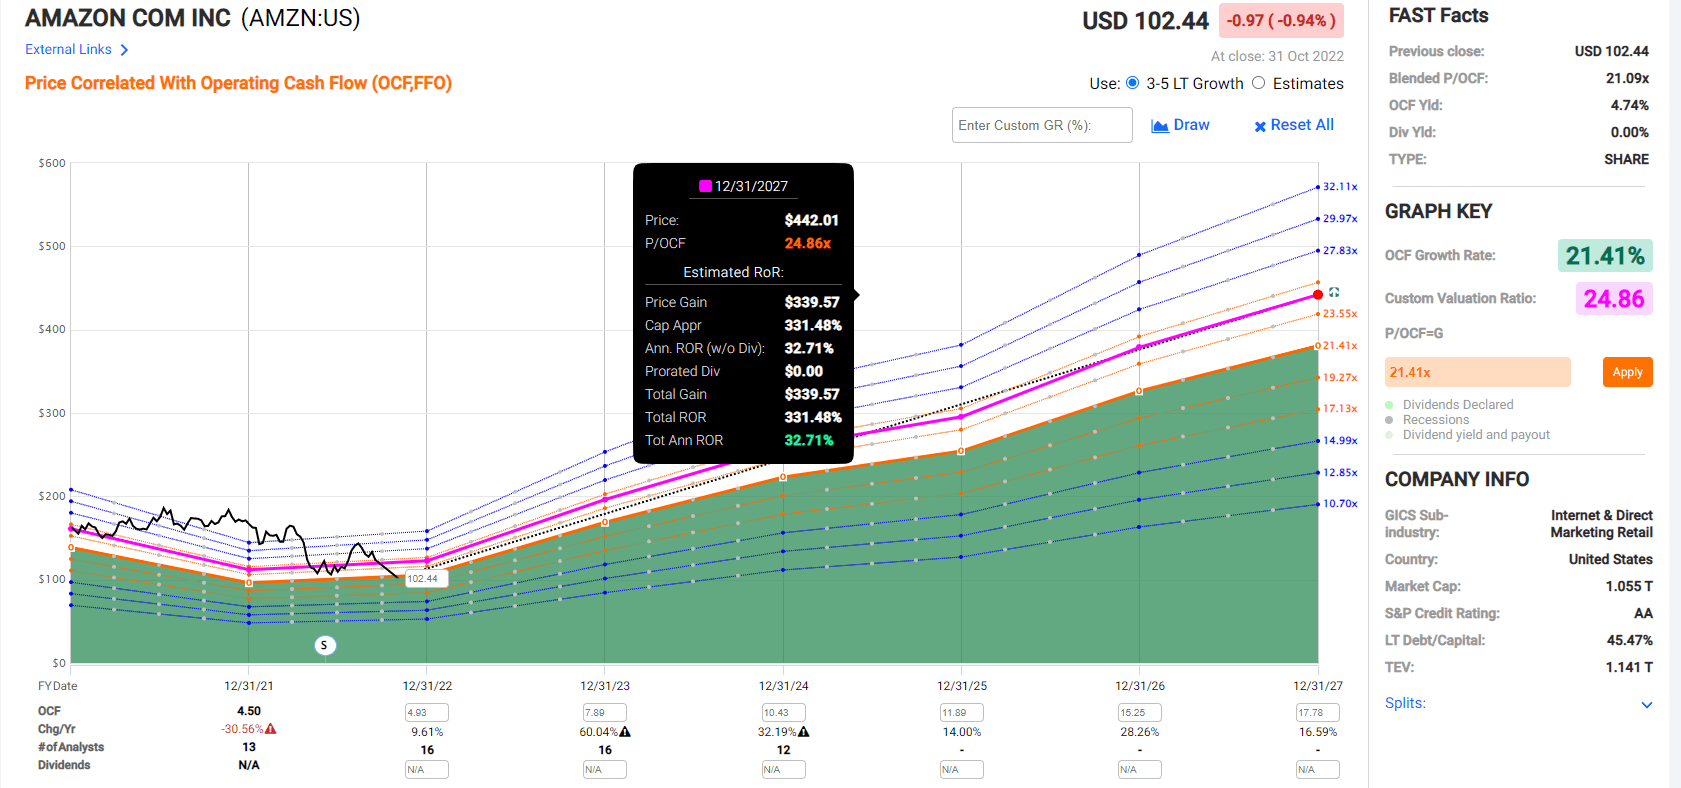
Over the next five years if Amazon grows as expected (21% annually) and returns to the low-end of historical fair value, it could deliver 331% returns or 33% CAGR.
- Buffett-like return potential from a hyper-growth deep value blue-chip bargain hiding in plain sight
- 7X the S&P 500 consensus
AMZN Corp Investment Decision Tool
DK
(Source: Dividend Kings Automated Investment Decision Tool)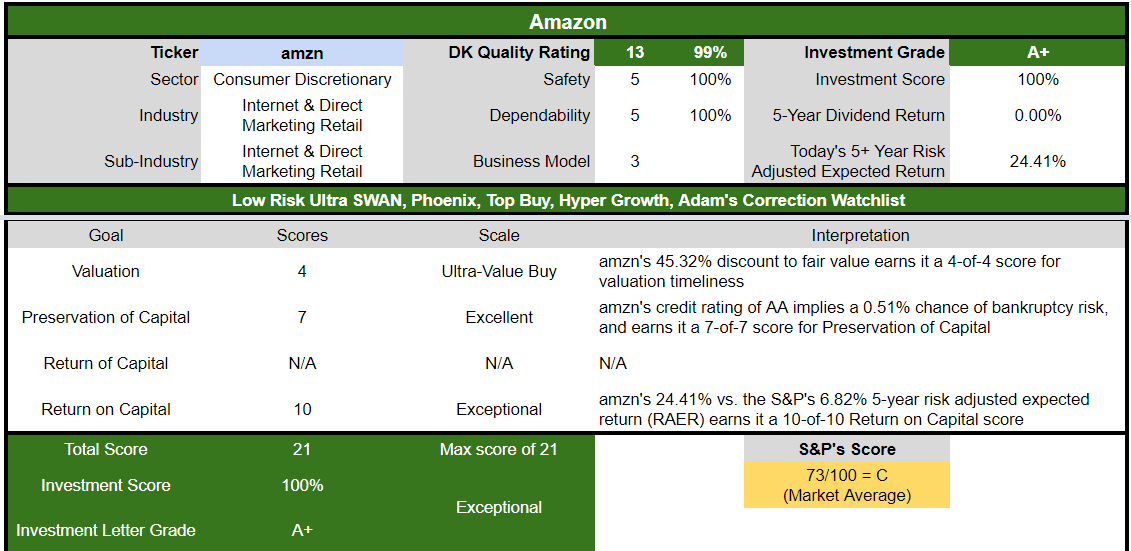
AMZN is as close to a perfect hyper-growth blue-chip opportunity as exists on Wall Street for anyone comfortable with its risk profile. Look at how it compares to the S&P 500.
- 45% discount to fair value vs. 2% S&P = 43% better valuation
- almost 2X better long-term annual return potential
- about 4X higher risk-adjusted expected returns
Reason Two: Still One Of The Best Growth Blue-Chips On Earth
Amazon is priced for about 11% long-term growth right now, according to the Graham/Dodd fair value formula. Here’s what analysts actually expect.
| Metric | 2022 Growth Consensus | 2023 Growth Consensus (recession) | 2024 Growth Consensus | 2025 Growth Consensus | 2026 Growth Consensus |
2027 Growth Consensus |
| Sales | 10% | 11% | 14% | 11% | 14% | 12% |
| EPS | -103% | 2300% | 75% | 35% | 45% | 30% |
| Operating Cash Flow | 7% | 66% | 36% | 14% | 28% | 17% |
| Free Cash Flow | -27% | 242% | 217% | 59% | 59% | 29% |
| EBITDA | 49% | 18% | 23% | NA | NA | NA |
| EBIT (operating income) | -49% | 92% | 78% | NA | NA | NA |
(Sources: FAST Graphs, FactSet)
The 2022 slow-down can be plainly seen, but after this year Amazon is expected to return to hyper-growth form with double-digit cash-flow growth and explosive FCF growth (59% CAGR through 2027).
Long-Term Growth Outlook
(Source: FactSet Research Terminal)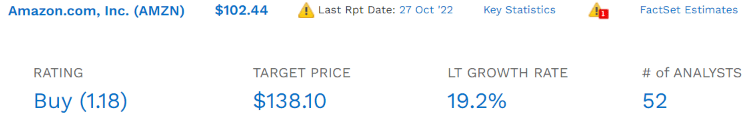
- 19.2% to 33.4% CAGR growth consensus range (from four sources)
- 19.2% CAGR median long-term growth consensus from all 52 analysts
How accurate are analysts at forecasting Amazon’s growth?
(Source: FAST Graphs, FactSet)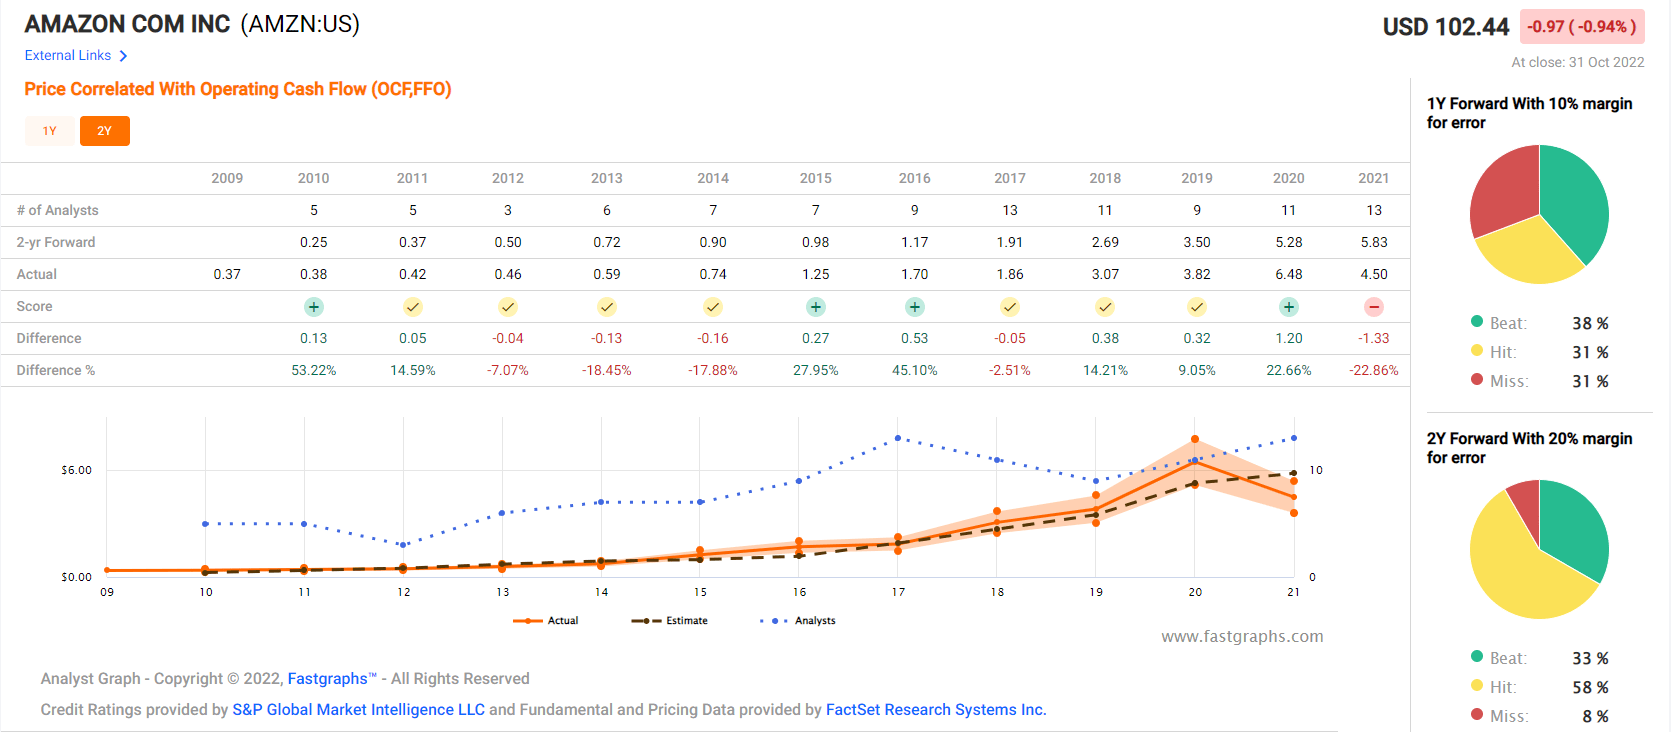
- smoothing for outliers 15% margins of error to the downside and 25% to the upside
- 16% to 42% CAGR long-term margin-of-error-adjusted growth consensus
(Source: FAST Graphs, FactSet) (Source: FAST Graphs, FactSet) (Source: FAST Graphs, FactSet) (Source: FAST Graphs, FactSet)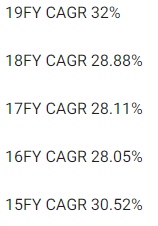
Amazon has grown as slowly as 14% annually over the last 20 years (and its average P/OCF was 31 during that time).
Analysts expecting 21% growth over the next few years is consistent with the growth rates of the last five years.
And Amazon’s dominant positions in various industries and massive growth potential in cloud and advertising make those estimates reasonable.
- #1 in cloud computing
- #3 in global retail sales
- #3 in advertising
- #2 in streaming
| Investment Strategy | Yield | LT Consensus Growth | LT Consensus Total Return Potential | Long-Term Risk-Adjusted Expected Return | Long-Term Inflation And Risk-Adjusted Expected Returns | Years To Double Your Inflation & Risk-Adjusted Wealth |
10-Year Inflation And Risk-Adjusted Expected Return |
| Amazon | 0% | 19.2% | 19.2% | 13.4% | 11.2% | 6.4 | 2.88 |
| Nasdaq | 0.8% | 11.5% | 12.3% | 8.6% | 6.3% | 11.4 | 1.85 |
| Schwab US Dividend Equity ETF | 3.6% | 8.5% | 12.1% | 8.4% | 6.2% | 11.7 | 1.82 |
| Dividend Aristocrats | 2.6% | 8.5% | 11.1% | 7.8% | 5.5% | 13.1 | 1.71 |
| S&P 500 | 1.8% | 8.5% | 10.3% | 7.2% | 4.9% | 14.6 | 1.62 |
(Sources: DK Research Terminal, Morningstar, FactSet, Ycharts)
Analysts expect Amazon to deliver 19.2% CAGR long-term returns (ignoring valuations entirely) which is about 2X more than the S&P 500 and far more than almost any investment strategy, including the Nasdaq.
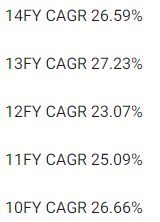
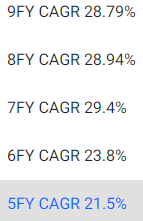
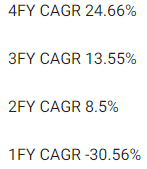
AMZN Historical Returns Since 1997
(Source: Portfolio Visualizer Premium)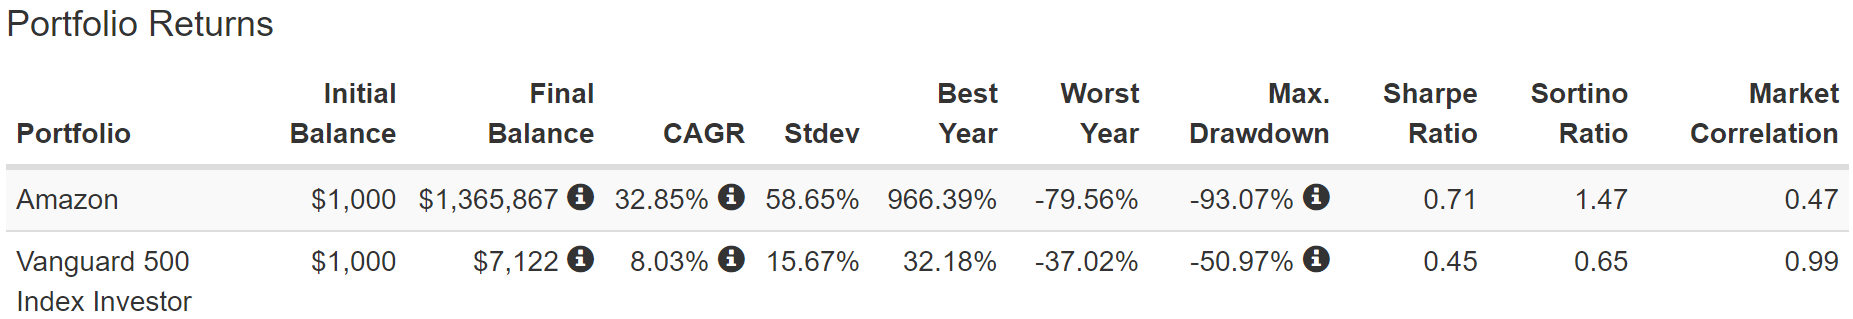
(Source: Portfolio Visualizer Premium) (Source: Portfolio Visualizer Premium)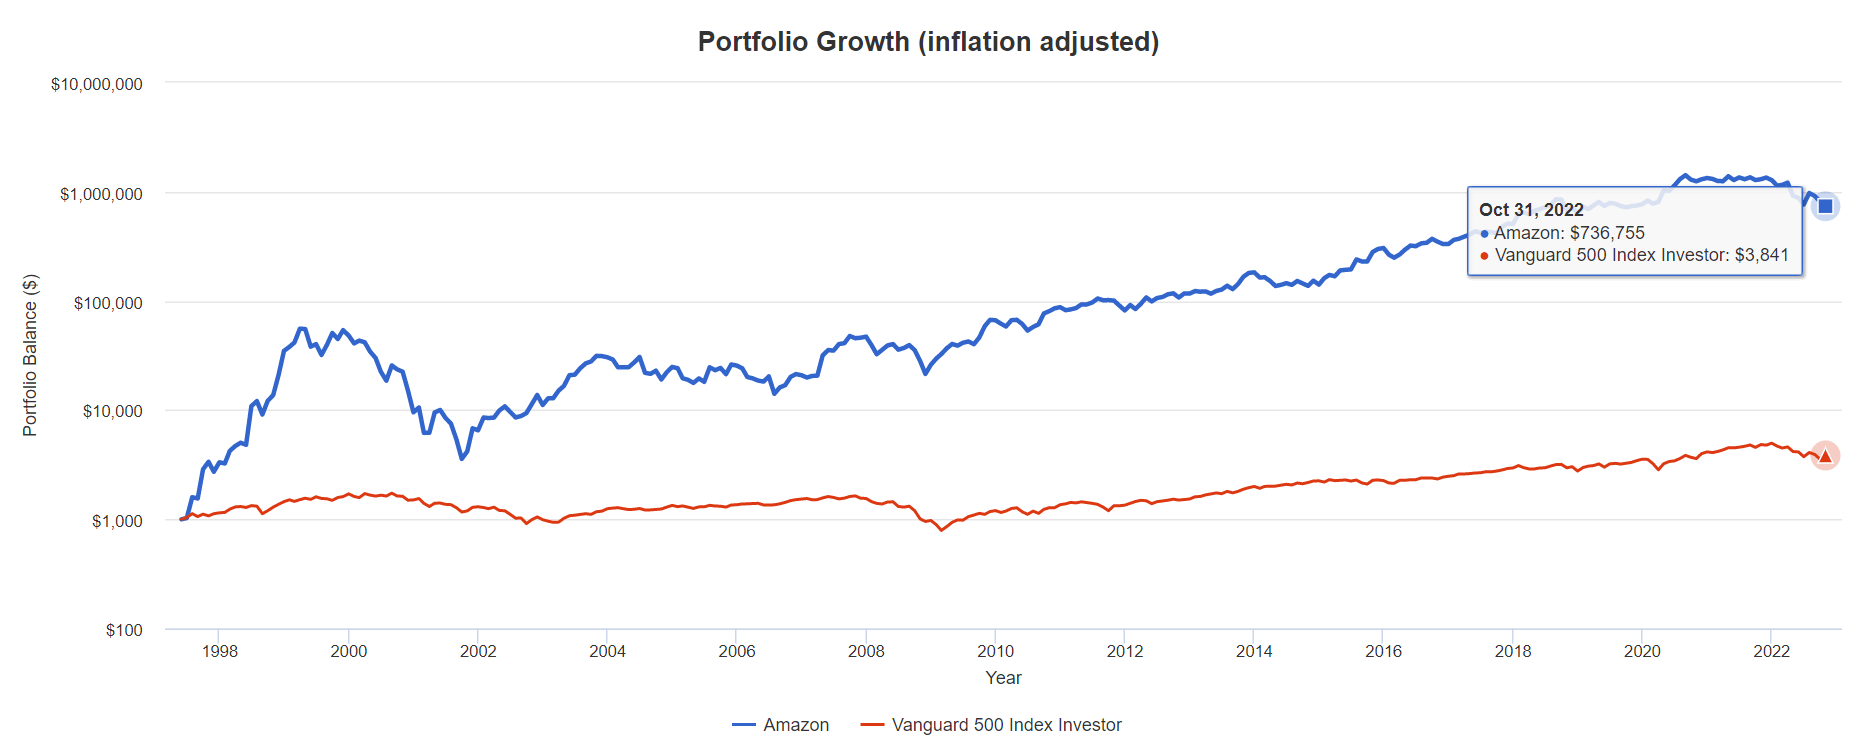
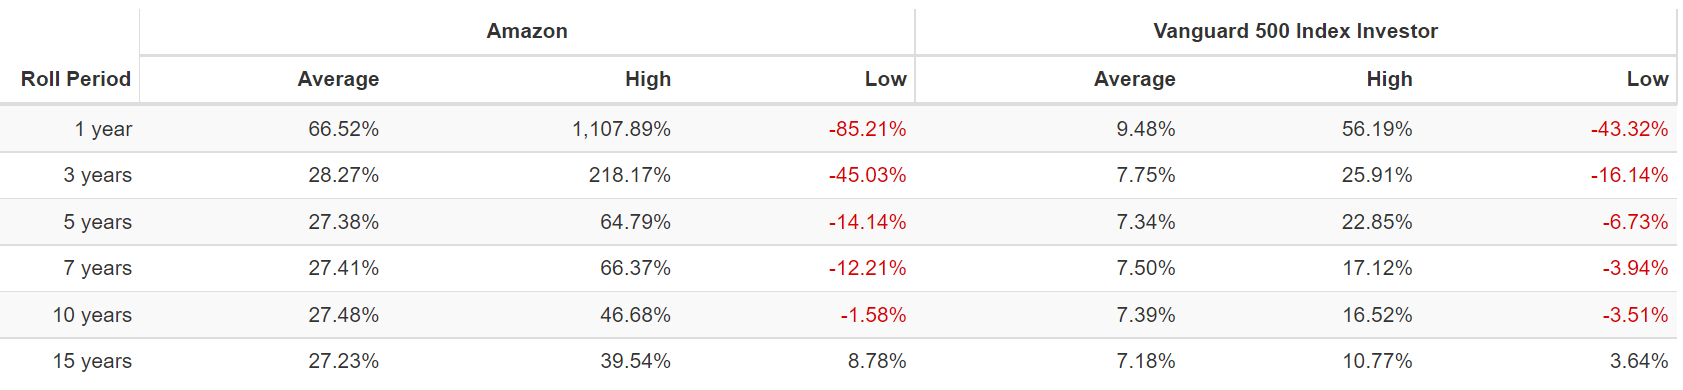
Amazon has delivered 737X inflation-adjusted returns since July of 1997, 194X more than the S&P 500. It’s average 15 year rolling return is 27% CAGR, but from bear market bottoms its delivered as much as 65% annual returns over the next 5 years and 40% annually over the next 15 years.
- 12X in 5 years
- 156X over 15 years
Inflation-Adjusted Consensus Total Return Potential: $1,000 Initial Investment
| Time Frame (Years) | 8.0% CAGR Inflation-Adjusted S&P 500 Consensus | 8.8% Inflation-Adjusted Aristocrat Consensus | 16.9% CAGR Inflation-Adjusted AMZN Consensus | Difference Between Inflation-Adjusted AMZN Consensus And S&P Consensus |
| 5 | $1,468.65 | $1,526.66 | $2,185.90 | $717.25 |
| 10 | $2,156.93 | $2,330.70 | $4,778.15 | $2,621.22 |
| 15 | $3,167.77 | $3,558.19 | $10,444.54 | $7,276.77 |
| 20 | $4,652.33 | $5,432.16 | $22,830.69 | $18,178.35 |
| 25 | $6,832.64 | $8,293.08 | $49,905.54 | $43,072.90 |
| 30 | $10,034.74 | $12,660.73 | $109,088.38 | $99,053.64 |
(Source: DK Research Terminal, FactSet)
Even if Amazon only grows 2X as fast as the S&P for 10 years, that’s a potential 5X inflation-adjusted return (ignoring its deep discount to fair value entirely).
Over a retirement time frame of 30 years, Amazon has the potential to deliver life-changing returns.
| Time Frame (Years) | Ratio Inflation-Adjusted AMZN Consensus/Aristocrat Consensus | Ratio Inflation-Adjusted AMZN Consensus vs. S&P consensus |
| 5 | 1.43 | 1.49 |
| 10 | 2.05 | 2.22 |
| 15 | 2.94 | 3.30 |
| 20 | 4.20 | 4.91 |
| 25 | 6.02 | 7.30 |
| 30 | 8.62 | 10.87 |
(Source: DK Research Terminal, FactSet)
Even ignoring valuation, and assuming that AMZN trades at 14X cash flow forever from now on, AMZN has the potential to double the S&P over the next 10 years and 5X its returns over the next 20.
Reason Three: A Wonderful Company At An Unbelievably Wonderful Price
(Source: FAST Graphs, FactSet)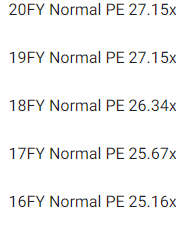
(Source: FAST Graphs, FactSet) (Source: FAST Graphs, FactSet) (Source: FAST Graphs, FactSet)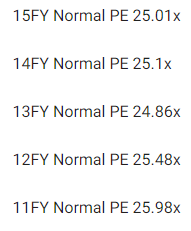
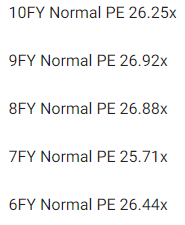
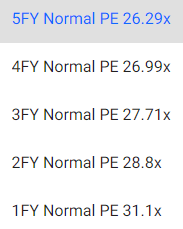
For 20 years, outside of bear markets and bubbles, investors have paid 25X to 27X cash flow for Amazon.
- a 91% statistical probability this range includes historical fair value
- even growing at 8% to 13% Amazon was valued at 28X to 31X cash flow
| Metric | Historical Fair Value Multiples (14-Years) | 2021 | 2022 | 2023 | 2024 | 2025 |
12-Month Forward Fair Value |
| Operating Cash Flow | 24.86 | $111.87 | $119.58 | $197.89 | $259.29 | $295.59 | |
| Average | $111.87 | $119.58 | $197.89 | $259.29 | $295.59 | $187.34 | |
| Current Price | $102.44 | ||||||
|
Discount To Fair Value |
8.43% | 14.33% | 48.23% | 60.49% | 65.34% | 45.32% | |
| Upside To Fair Value | 9.21% | 16.73% | 93.17% | 153.11% | 188.54% | 82.88% | |
| 2022 OCF | 2023 OCF | 2022 Weighted OCF | 2023 Weighted OCF | 12-Month Forward OCF | 12-Month Average Fair Value Forward P/OCF | Current Forward P/OCF |
Current Forward Cash-Adjusted PE |
| $4.81 | $7.96 | $0.65 | $6.89 | $7.54 | 24.9 | 13.6 | 13.9 |
I estimate that AMZN is historically worth 25X cash flow, the low end of its historical range.
Today it trades at 13.6X cash flow and 13.9X cash-adjusted earnings.
- I was able to buy AMZN at 10X cash flow on its earnings freakout crash
- a 52% historical discount
| Rating | Margin Of Safety For Low Risk 13/13 Ultra SWAN Quality Companies | 2022 Fair Value Price | 2023 Fair Value Price |
12-Month Forward Fair Value |
| Potentially Reasonable Buy | 0% | $119.58 | $197.89 | $187.34 |
| Potentially Good Buy | 5% | $113.60 | $187.99 | $177.98 |
| Potentially Strong Buy | 15% | $101.64 | $168.20 | $159.24 |
| Potentially Very Strong Buy | 25% | $85.20 | $148.41 | $140.51 |
| Potentially Ultra-Value Buy | 35% | $77.72 | $128.63 | $121.77 |
| Currently | $102.44 | 14.33% | 48.23% | 45.32% |
| Upside To Fair Value (Including Dividends) | 16.73% | 93.17% | 82.88% |
For anyone comfortable with its risk profile, AMZN is a potential Ultra Value Buffett-style fat pitch.
Risk Profile: Why Amazon Isn’t Right For Everyone
There are no risk-free companies and no company is right for everyone. You have to be comfortable with the fundamental risk profile.
AMZN’s Risk Profile Includes
- inherent cyclicality of retail with the economy
- disruption risk (nearly 1,000 major competitors globally) including MSFT FB, and GOOG in its most important businesses
- political/regulatory risk – anti-trust risk domestically and globally
- global expansion risk (not as easy to disrupt foreign markets with entrenched giants)
- new market penetration risk: healthcare especially is a very highly regulated and challenging industry to disrupt
- M&A execution risk
- labor retention risk (tightest job market in over 50 years and finance is a high paying industry)
- Labor relations risk: the introduction of unions could increase labor expenses by approximately $150 million per 1% of the work-force (up to $15 billion per year)
- cybersecurity risk: hackers and ransomware
- currency risk: almost 40% of sales are from outside the US
Long-Term Risk Analysis: How Large Institutions Measure Total Risk
- see the risk section of this video to get an in-depth view (and link to two reports) of how DK and big institutions measure long-term risk management by companies
DK uses S&P Global’s global long-term risk-management ratings for our risk rating.
- S&P has spent over 20 years perfecting their risk model
- which is based on over 30 major risk categories, over 130 sub categories, and 1,000 individual metrics
- 50% of metrics are industry specific
- this risk rating has been included in every credit rating for decades
The DK risk rating is based on the global percentile of how a company’s risk management compares to 8,000 S&P-rated companies covering 90% of the world’s market cap.
AMZN Scores 68th Percentile On Global Long-Term Risk Management
S&P’s risk management scores factor in things like:
- supply chain management
- crisis management
- efficiency
- labor relations
- customer relationship management
- climate strategy adaptation
- corporate governance
- brand management
AMZN’s Long-Term Risk Management Is The 214th Best In The Master List (57 Percentile In The Master List)
| Classification | S&P LT Risk-Management Global Percentile |
Risk-Management Interpretation |
Risk-Management Rating |
| BTI, ILMN, SIEGY, SPGI, WM, CI, CSCO, WMB, SAP, CL | 100 | Exceptional (Top 80 companies in the world) | Very Low Risk |
| Strong ESG Stocks | 86 |
Very Good |
Very Low Risk |
| Foreign Dividend Stocks | 77 |
Good, Bordering On Very Good |
Low Risk |
| Ultra SWANs | 74 | Good | Low Risk |
| Amazon | 68 | Above-Average (Bordering On Good) | Low Risk |
| Dividend Aristocrats | 67 | Above-Average (Bordering On Good) | Low Risk |
| Low Volatility Stocks | 65 | Above-Average | Low Risk |
| Master List average | 61 | Above-Average | Low Risk |
| Dividend Kings | 60 | Above-Average | Low Risk |
| Hyper-Growth stocks | 59 | Average, Bordering On Above-Average | Medium Risk |
| Dividend Champions | 55 | Average | Medium Risk |
| Monthly Dividend Stocks | 41 | Average | Medium Risk |
(Source: DK Research Terminal)
AMZN’s risk-management consensus is in the top 43% of the world’s highest quality companies and similar to that of such other blue-chips as
- Hormel Foods (HRL): Ultra SWAN dividend king
- Realty Income (O): Ultra SWAN dividend aristocrat
- Enterprise Products Partners (uses K-1 tax form) (EPD): Ultra SWAN
- Nike (NKE): Ultra SWAN
- Eli Lilly (LLY): Ultra SWAN
The bottom line is that all companies have risks, and AMZN is above-average, at managing theirs according to S&P.
How We Monitor AMZN’s Risk Profile
- 52 analysts
- three credit rating agencies
- 55 experts who collectively know this business better than anyone other than management
- and the bond market for real-time fundamental risk-assessments
When the facts change, I change my mind. What do you do, sir?” – John Maynard Keynes
There are no sacred cows at iREIT or Dividend Kings. Wherever the fundamentals lead, we always follow. That’s the essence of disciplined financial science, the math behind retiring rich and staying rich in retirement.
Bottom Line: Amazon Is One Of The Best Buffett-Style “Fat Pitches” On Wall Street
Let me be clear: I’m NOT calling the bottom in AMZN (I’m not a market-timer).
Sleep Well At Night doesn’t mean “can’t fall hard in a bear market.”
Fundamentals are all that determine safety and quality, and my recommendations.
- over 30+ years, 97% of stock returns are a function of pure fundamentals, not luck
- in the short term; luck is 25X as powerful as fundamentals
- in the long term, fundamentals are 33X as powerful as luck
While I can’t predict the market in the short term, here’s what I can tell you about AMZN.
- One of the highest quality, safest, and most dependable hyper-growth blue chips on earth.
- 19.2% CAGR long-term total return consensus, better than almost any popular investment strategy.
- 45% historically undervalued, a potentially Ultra Value Buffett-style table-pounding “fat pitch”
- 13.6X cash flow (11% growth priced in vs 19% consensus and 21% consensus through 2027)
- 330% consensus return potential over the next five years, 33% CAGR, about 7X more than the S&P 500
- 4X the risk-adjusted expected returns of the S&P 500 over the next five years, and an incredible 24% CAGR
Amazon has minted millionaires over the decades, but not without extreme volatility.
Amazon Peak Declines Since 1997
Portfolio Visualizer Premium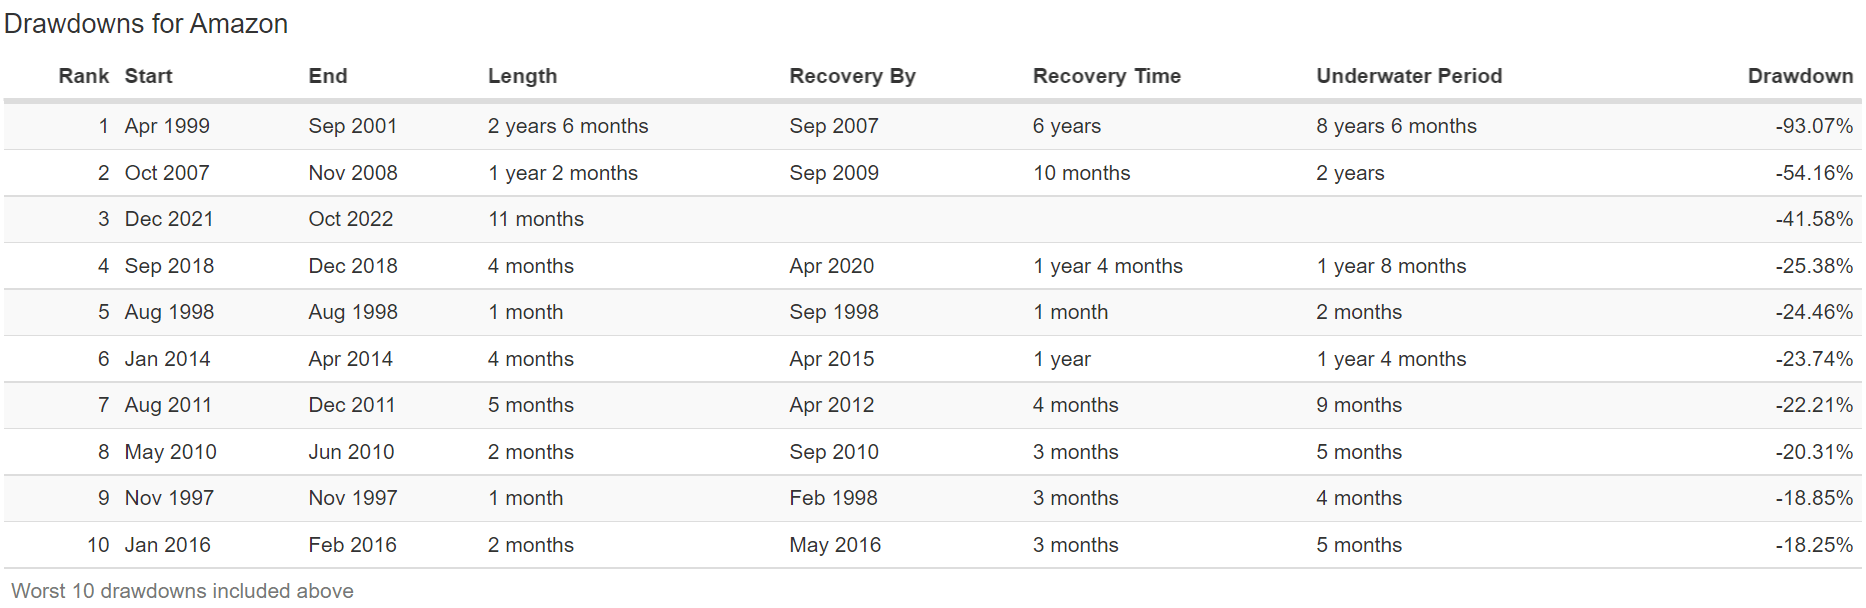
Amazon has experienced eight bear markets and three crashes over the last quarter century.
- about one every two years
These bear markets usually are a combination of negative market sentiment and concerns that the company’s growth machine is broken.
And it can take a long time for Amazon to claw its way out of its bear markets, up to 8.5 years.
Amazon’s current bear market is just under 1 year old. I can’t tell you how long it will last, though chances are good that it will bottom sometime in 2023 (though it might have potentially bottomed at $87 on earnings crash day).
What I can tell you with very high confidence is that Amazon’s thesis remains intact.
- #1 in cloud computing
- #3 in global retail sales
- #3 in advertising
- #2 in streaming
Amazon is the quintessential disruptive innovator, and within a few years healthcare could become another major world to conquer for Amazon.
Amazon is one of the world’s best hyper-growth blue-chips, and a likely future dividend growth world-beater.
But most of all, Amazon is crazy, stupid, cheap, a 45% undervalued Buffett-style table-pounding “fat pitch”.
Wait for a fat pitch and then swing for the fences.” – Warren Buffett
I can’t tell you where Amazon will bottom in 2022 or 2023, but I can say with 80% statistical confidence that it will be a lot higher in the next 5+ years.
When you combine Amazon’s fortress balance sheet, incredible valuation, with its strong risk management, many wide moat businesses, and incredible growth potential, you get a potential rich retirement dream machine.
And that’s why I recently bought Amazon four more times, backing up the truck on one of my favorite companies of all time.
And if you are a patient long-term investor, willing to look beyond the short-term pain of this recession, I’m confident that you’ll be thrilled if you buy Amazon today. Maybe not today, maybe not tomorrow, but within a few years, you’ll likely feel like a stock market genius.
To paraphrase Napoleon, a stock market genius is just
The investor who can do the average thing when everyone else around him/her is losing their mind.”
Be the first to comment