

peshkov
Dreams of a V-shaped recovery after the worst day for stocks in two years have been dashed.
The Yen carry trade unwind likely isn’t over yet.
However, the Bank of Japan has calmed panic in Japanese rates by promising to hike rates gradually.
That being said, with $500 billion left in carry trade and US recession risks.
The US recession risk remains elevated, the market remains jittery, and extreme fear rules Wall Street.
CNN CNN

Dividend Aristocrats Have Been A Port In This Market Storm
YCharts
Dividend aristocrats and S&P companies with 25+ year dividend growth streaks are historically lower volatility and very dependable blue chips, precisely the sleep-well-at-night investments that can help investors get through this significant volatility spike.
Charlie Bilello
Extreme volatility is the best friend of long-term investors.
Charlie Bilello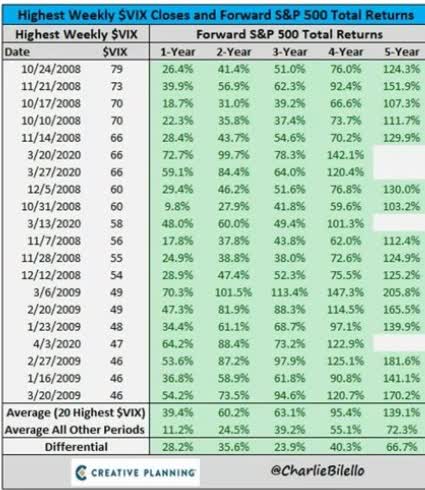
Volatility, which is high historically, results in 100% to 140% returns within the next four to five years, resulting in 15% to 25% annual stock returns.
But of course, first, you must emotionally survive the correction’s end, which no one can predict.
So let me share with you how we can double down on the lower volatility nature of dividend aristocrats to achieve higher yield, even lower volatility, and crank up the SWANiness to 11.
How To Find The Lowest Volatility Aristocrats
| Screening Criteria | Companies Remaining | % Of Master List | |
| 1 |
Add “12-month fundamentally justified upside, 5-year total return potential, and dividend growth streaks” Under “Columns.” |
0.00% | |
| 2 | BHS rating (reasonable buy, good buy, strong buy, very strong buy, ultra value buy) | 317 | 63.15% |
| 3 | Under Lists “Dividend Champions” | 86 | 17.13% |
| 4 | Non-Speculative | 75 | 14.94% |
| 5 | Consensus Long-Term Return Potential 8+% | 56 | 11.16% |
| 4 | Sort By Volatility | 310 | 61.75% |
| 7 | 18.6% Volatility Cutoff | 10 | 1.99% |
| Total Time | 2 minutes |
(Source: Dividend Kings Zen Research Terminal)
The first thing I always do when screening for a company is to screen for companies that aren’t overvalued.
You might think that, in a correction, everything is on sale, but that’s not true.
On Monday, when the S&P fell as much as 4.5%, 5% of stocks were still trading at record highs, and 40% were still historically overvalued.
So once we screen out the 37% of overvalued stocks, we’re left with 86 out of 137 dividend champions, which include every 25+ year dividend growth streak company, including foreign aristocrats.
Eliminating speculative companies means avoiding turnaround stories that can fail and result in a dividend cut, like what Walgreens (WBA) has suffered this year.
YCharts
But, of course, avoiding struggling, overvalued aristocrats is just the first step.
Defensive stocks are designed to outperform a 60-40, or at least they should. This means they should deliver 8% or higher returns, or else you can get similar returns with bonds.
And I think you’ll agree the results are most impressive, generating high-yield, incredibly low volatility, and total returns and income growth that surpass the historical returns of the S&P.
10 High-Yield Dividend Aristocrats, Perfect For This Market Downturn
Dividend Kings Zen Research Terminal
Fundamental Summary
The 3% yield is the same as Vanguard High Dividend Yield ETF (VYM), 2X that of the S&P, and 0.5% higher than the dividend aristocrats.
While the S&P remains 1% historically overvalued, these low-volatility defensive aristocrats are 11% undervalued.
They are growing at 7.2%, according to the median growth consensus from all analysts covering them.
Based on current fundamentals, these undervalued high-yield aristocrats have a 17% upside potential in the next year.
That’s not a forecast; it means “if and only if these companies grow as expected and return to historical market-determined fair value, a 17% gain would be justified by fundamentals.”
The 5-year consensus return potential from the FactSet consensus is 10.83%, slightly above the long-term 10.2% long-term return consensus.
The 60-40 historically delivers 7% annual returns, and institutions like pensions and endowments consider 8+% defensive returns excellent.
That means anyone living off dividends can expect 7% to 8% dividend growth, well above the 2.3% long-term inflation priced into bonds.
For anyone reinvesting dividends, 10% to 11% income growth is expected, courtesy of 10.2% long-term returns, higher than the S&P’s 10% returns over the last 220 years.
These low-volatility, high-yield aristocrats have a 45-year average dividend growth streak, approaching dividend king status.
- Dividend Kings = any company with a 50+ year dividend growth streak.
According to S&P, the average credit rating is A-stable with 3.19% 30-year bankruptcy risk.
The 96% dividend safety score indicates a less than 0.5% risk of a dividend cut right now, a lower than 1% risk in an average recession, and less than 2% risk in a Great Recession or pandemic-level economic crash.
The long-term risk management ratings are in the 85th percentile, meaning that S&P rates these aristocrats as the best 15% of companies in the world managing over 1,000 kinds of risk.
S&P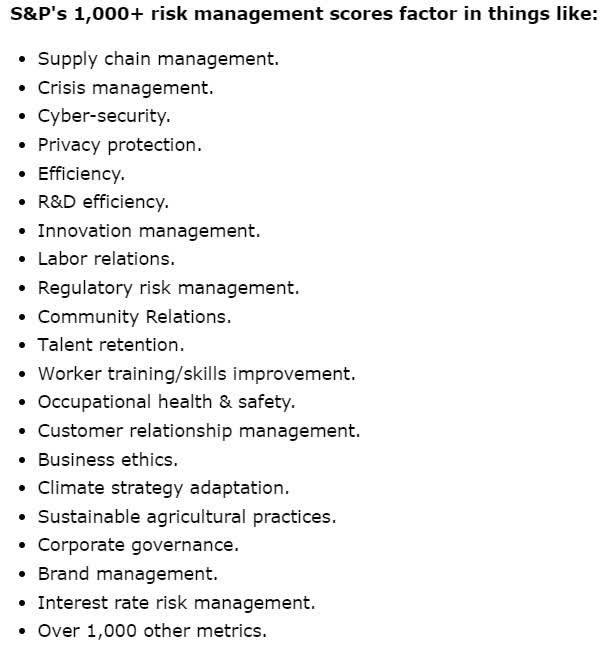
S&P credit ratings incorporate the long-term risk management ratings to ensure that they factor in critical skills by management in things like interest rate risk management, innovation management, worker retention, and cyber-security.
Historical Returns Since 1996
Portfolio Visualizer Premium
For almost 30 years, these aristocrats delivered slightly better than market returns, with 30% lower annual volatility.
Their peak decline was 24% during the Great Recession, half as alarming as the S&P.
- 60-40 retirement portfolio fell 44%.
Portfolio Visualizer Premium
The peak decline in the 2022 bear market was -14%, better than the 60-40’s 21% decline and the S&P’s -24% (-28% intraday peak decline).
Portfolio Visualizer Premium
In most (though not all) market downturns, these aristocrats are a lot less volatile.
Portfolio Visualizer Premium
The S&P has had six bear markets in the last 30 years, and these aristocrats have only had one.
Portfolio Visualizer Premium
Very consistent returns over time, including no five years of negative returns.
The worst 10-year return was 5.9% annual returns, while the S&P suffered as much as -30% after a decade following the tech bubble.
Portfolio Visualizer
In April, stocks fell 4% (peak decline of 5.9%). These aristocrats fell half as much.
In August, the S&P was down 6%; these aristocrats were up 1%, while the dividend aristocrats were down 1%.
Income Growth
Portfolio Visualizer
Per $1,000 Initial Investment
| Metric | 10 High-Yield Low Volatility Dividend Aristocrats | S&P 500 |
| Income Growth | 10.7% | 7.8% |
| Cumulative Dividends | $4,666.83 | $1,666.79 |
| Yield On Cost | 52.77% | 14.31% |
(Source: Portfolio Visualizer)
Income growth closely tracked total returns of 11% annually, as did it for the S&P.
These aristocrats delivered 3X the cumulative dividend, nearly repaying investors’ initial investment 5X over the last 28 years.
(Source: Portfolio Visualizer)
These aristocrats have a historical beta of 0.43. For context, most hedge funds have betas of 0.4 to 0.6.
They have generated 6% annual alpha, meaning 6% better returns than expected from low-volatility companies.
Their volatility-adjusted returns were 2.5X better.
Treynor Ratio is the excess returns above risk-free cash per unit of volatility.
(Source: Portfolio Visualizer)
These aristocrats delivered exceptionally low volatility, just 36% of the market’s downside capture in a falling market.
They went up 57%, which is as much as the market in rising markets.
That’s compared to 80% downside capture and 70% upside capture for the 60-40.
- 1.53 upside/downside capture ratio vs 0.88 60-40.
OK, these are some impressive high-yield, super-low-volatility aristocrats, but that doesn’t mean they don’t offer attractive short-term return potential.
Consensus 2026 Total Return Potential
- Not a forecast.
- Consensus return potential.
- These are the expected returns if and only if these companies grow as expected and return to historical fair value by the end of 2026.
- Fundamentals would justify that.
Average: 49% = 14.2% annually vs 35% or 12% annually S&P.
1-Year Fundamentally Justified Upside Potential: 17% vs 15% S&P.
Johnson & Johnson (JNJ) 2026 Consensus Return Potential
FAST Graphs, FactSet
PepsiCo (PEP) 2026 Consensus Return Potential
FAST Graphs, FactSet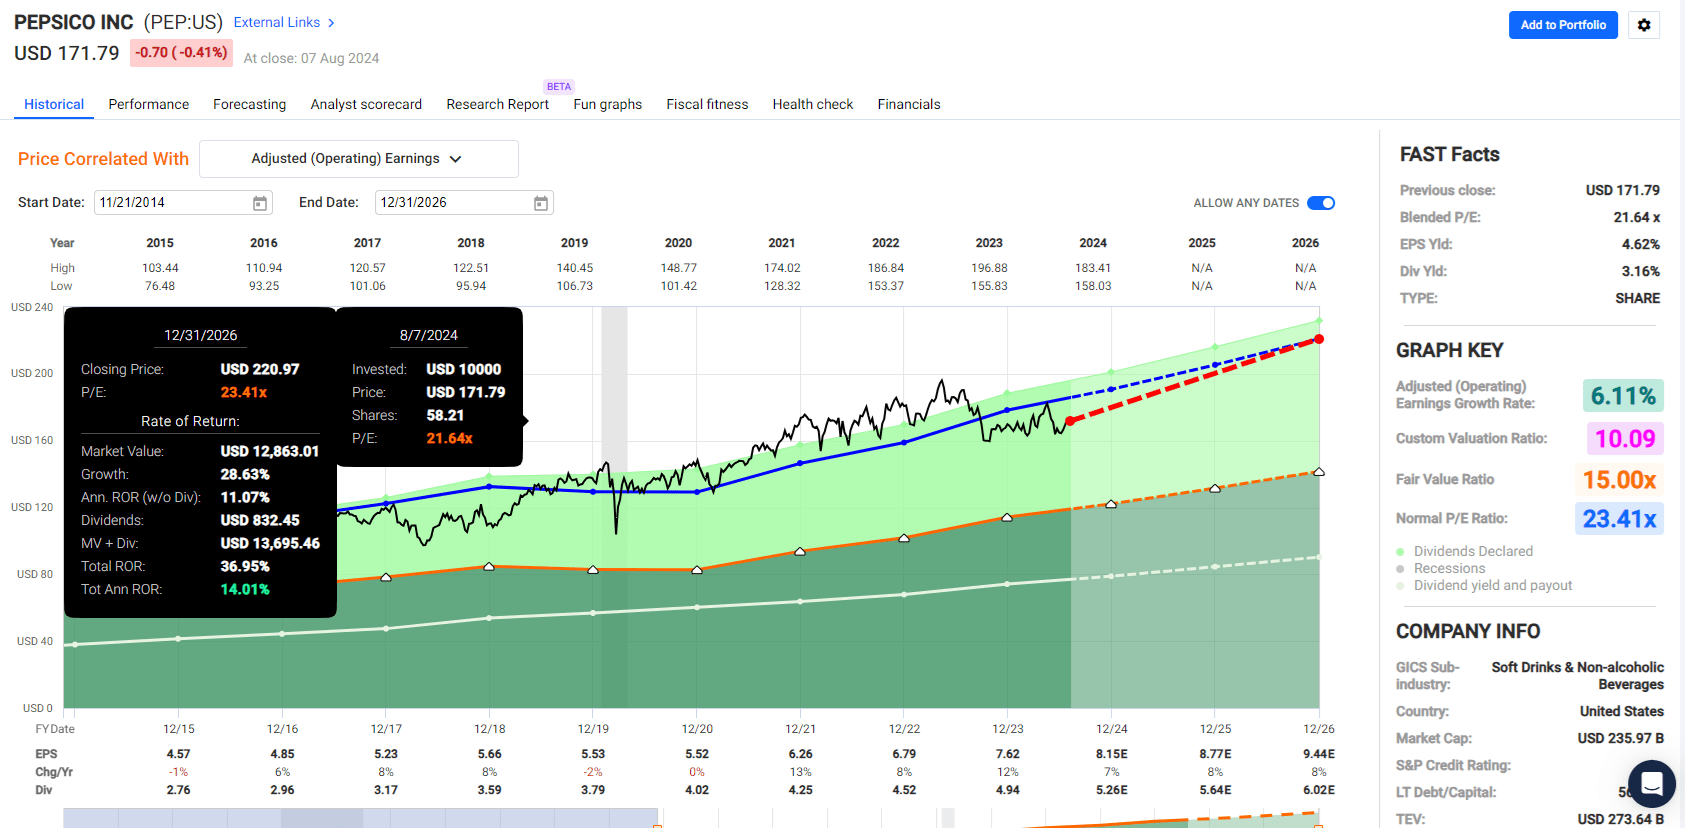
McDonald’s (MCD) 2026 Consensus Return Potential
FAST Graphs, FactSet
Kimberly-Clark (KMB) 2026 Consensus Return Potential
FAST Graphs, FactSet
Diageo (DEO) 2026 Consensus Return Potential
FAST Graphs, FactSet
Becton, Dickinson and Company (BDX) 2026 Consensus Return Potential
FAST Graphs, FactSet
Clorox (CLX) 2026 Consensus Return Potential
FAST Graphs, FactSet
Fortis (FTS) 2026 Consensus Return Potential
FAST Graphs, FactSet
Novartis (NVS) 2026 Consensus Return Potential
FAST Graphs, FactSet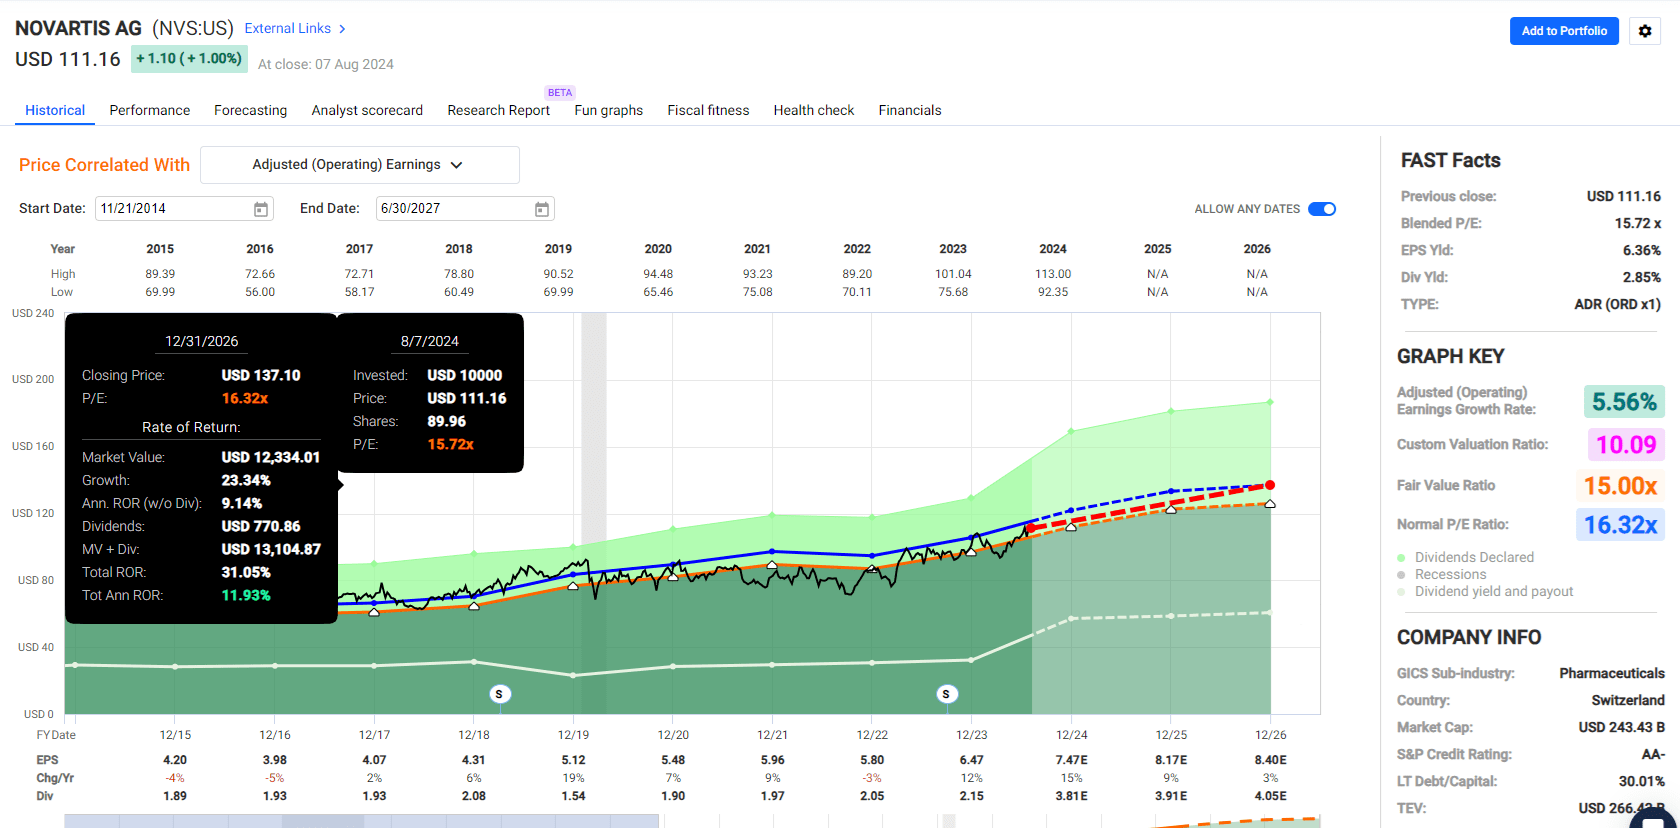
McCormick (MKC) 2026 Consensus Return Potential
FAST Graphs, FactSet
Risks To Consider: No Stock Is A Bond Alternative
The fact that these aristocrats are up 1% in this pullback doesn’t mean they should be expected to go up in the average correction.
Portfolio Visualizer
Stocks should always be assumed to decline in corrections, even though some always go up, even in bear markets.
It would be best to manage your psychological risk through asset allocation, not market timing or getting lucky by owning something up in a correction.
How volatile can low-volatility aristocrats like these get?
Worst 10% S&P Months Since 1996
| 10 High-Yield Low Volatility Dividend Aristocrats | S&P 500 | ||
| Year | Month | Return | Return |
| 2008 | 10 | -7.64% | -16.52% |
| 1998 | 8 | -15.32% | -14.12% |
| 2020 | 3 | -3.28% | -12.46% |
| 2009 | 2 | -7.80% | -10.74% |
| 2002 | 9 | -4.12% | -10.49% |
| 2001 | 2 | 4.57% | -9.54% |
| 2008 | 9 | -1.80% | -9.44% |
| 2022 | 9 | -7.89% | -9.24% |
| 2018 | 12 | -6.23% | -8.79% |
| 2022 | 4 | 1.54% | -8.78% |
| 2008 | 6 | -3.77% | -8.35% |
| 2022 | 6 | -3.53% | -8.25% |
| 2009 | 1 | -4.53% | -8.21% |
| 2001 | 9 | 1.74% | -8.16% |
| 2010 | 5 | -5.32% | -7.95% |
| 2020 | 2 | -8.09% | -7.92% |
| 2002 | 7 | -8.03% | -7.88% |
| 2000 | 11 | 4.96% | -7.47% |
| 2002 | 6 | -4.37% | -7.38% |
| 2008 | 11 | -4.37% | -6.96% |
| 2011 | 9 | -3.06% | -6.94% |
| 2018 | 10 | -0.01% | -6.91% |
| 2019 | 5 | -0.62% | -6.38% |
| 2015 | 8 | -4.53% | -6.10% |
| 2008 | 1 | -5.68% | -6.05% |
| 2012 | 5 | -2.82% | -6.01% |
| 2001 | 8 | 2.82% | -5.93% |
| 2024 | 8 | 1.09% | -5.84% |
| 2002 | 4 | 0.88% | -5.82% |
| 2022 | 12 | -1.28% | -5.76% |
| 2002 | 12 | -1.98% | -5.66% |
| 2001 | 3 | -3.23% | -5.60% |
| 2011 | 8 | 0.60% | -5.50% |
| 2000 | 9 | 1.71% | -5.48% |
| Average | -2.92% | -8.02% | |
| Median | -3.26% | -7.68% |
(Source: Portfolio Visualizer)
While the average decline in the S&P’s worst months is just 3%, less than half that of the S&P, as Howard Marks likes to say:
A six-foot man can drown crossing a river that’s five feet deep on average.”
These aristocrats fell as much as the market in three months, including a 15% decline in August 1998.
The Downside Of Ultra Low Volatility: S&P’s 10% Best Months Since 1996
| 10 High-Yield Low Volatility Dividend Aristocrats | S&P 500 | ||
| Year | Month | Return | Return |
| 2020 | 4 | 8.52% | 12.70% |
| 2011 | 10 | 3.31% | 10.91% |
| 2020 | 11 | 5.46% | 10.88% |
| 2009 | 4 | 0.62% | 9.93% |
| 2000 | 3 | 2.01% | 9.69% |
| 2022 | 7 | 2.19% | 9.21% |
| 2023 | 11 | 3.20% | 9.13% |
| 2010 | 9 | 5.85% | 8.96% |
| 2015 | 10 | 6.07% | 8.51% |
| 2003 | 4 | 5.10% | 8.46% |
| 2009 | 3 | 1.84% | 8.35% |
| 2002 | 10 | 1.67% | 8.23% |
| 2022 | 10 | 8.37% | 8.13% |
| 1998 | 10 | 12.59% | 8.11% |
| 2019 | 1 | 1.25% | 8.01% |
| 1997 | 7 | 2.10% | 7.93% |
| 2001 | 11 | 0.93% | 7.80% |
| 2009 | 7 | 3.87% | 7.46% |
| 2001 | 4 | -1.28% | 7.04% |
| 2021 | 10 | 0.78% | 7.02% |
| 2020 | 8 | 0.06% | 6.98% |
| 2019 | 6 | 3.97% | 6.96% |
| 1998 | 2 | 7.06% | 6.93% |
| 2010 | 7 | 4.82% | 6.83% |
| 2016 | 3 | 4.54% | 6.72% |
| 2010 | 12 | 3.99% | 6.68% |
| 2000 | 8 | -0.71% | 6.60% |
| 1998 | 12 | 3.67% | 6.54% |
| 2023 | 6 | 3.68% | 6.48% |
| 1997 | 4 | 6.49% | 6.44% |
| 1999 | 10 | 3.80% | 6.41% |
| 1998 | 9 | 4.95% | 6.36% |
| 1997 | 5 | 2.78% | 6.32% |
| 2023 | 1 | -2.18% | 6.29% |
| Average | 3.57% | 7.91% | |
| Median | 3.68% | 7.63% |
(Source: Portfolio Visualizer)
In the top 10% of months, the S&P averages an 8% gain, while these ultra-low volatility averages half that.
Remember, historically, these capture 56% of the market’s upside.
In a bull market, there will be many tracking errors with the market, IE, “market envy” and “fear or missing out, FOMO.”
The Downside Of Ultra Low Volatility: S&P’s Top 10 Annual Returns Since 1996
| 10 High-Yield Low Volatility Dividend Aristocrats | S&P 500 | ||
| Year | Inflation | Return | Return |
| 1997 | 1.70% | 27.44% | 33.48% |
| 2013 | 1.50% | 22.69% | 32.31% |
| 2019 | 2.29% | 20.14% | 31.22% |
| 2021 | 7.04% | 12.25% | 28.75% |
| 1998 | 1.61% | 30.45% | 28.69% |
| 2003 | 1.88% | 25.20% | 28.17% |
| 2009 | 2.72% | 16.72% | 26.37% |
| 2023 | 3.35% | -1.27% | 26.19% |
| 2017 | 2.11% | 24.49% | 21.70% |
| 1999 | 2.68% | -9.83% | 20.39% |
| Average | 2.69% | 16.83% | 27.73% |
| Median | 2.20% | 21.42% | 28.43% |
(Source: Portfolio Visualizer)
In the best years, the S&P rips higher, and these aristocrats do well, but not nearly as well.
And sometimes, like the value bear market at the end of the tech bubble, the market can roar higher, and these aristocrats can lose money.
In 2023, they were down 1%, while the market rose 26%.
And no investing strategy works all the time.
Worst 10 Years
| 10 High-Yield Low Volatility Dividend Aristocrats | S&P 500 | ||
| Year | Inflation | Return | Return |
| 2008 | 0.09% | -13.85% | -36.81% |
| 1999 | 2.68% | -9.83% | 20.39% |
| 2002 | 2.38% | -4.87% | -21.59% |
| 2022 | 6.5% | -3.0% | -18.2% |
| 1996 | 0.00% | -1.43% | -2.38% |
| 2023 | 3.35% | -1.27% | 26.19% |
| 2001 | 1.55% | 3.51% | -11.76% |
| 2024 | 2.42% | 3.76% | 9.82% |
| 2016 | 2.07% | 4.01% | 12.00% |
| 2005 | 3.42% | 5.19% | 4.83% |
| Average | -1.78% | -1.75% | |
| Median | -1.35% | 1.23% |
(Source: Portfolio Visualizer)
Worst 10% of Months
| 10 High-Yield Low Volatility Dividend Aristocrats | S&P 500 | ||
| Year | Month | Return | Return |
| 1998 | 8 | -15.32% | -14.12% |
| 2020 | 2 | -8.09% | -7.92% |
| 2002 | 7 | -8.03% | -7.88% |
| 2022 | 9 | -7.89% | -9.24% |
| 2009 | 2 | -7.80% | -10.74% |
| 1997 | 8 | -7.64% | -5.18% |
| 2008 | 10 | -7.64% | -16.52% |
| 2000 | 1 | -6.75% | -4.94% |
| 2001 | 1 | -6.68% | 4.45% |
| 2023 | 9 | -6.28% | -4.74% |
| 2018 | 12 | -6.23% | -8.79% |
| 2018 | 2 | -6.10% | -3.64% |
| 2008 | 1 | -5.68% | -6.05% |
| 2023 | 5 | -5.39% | 0.46% |
| 2010 | 5 | -5.32% | -7.95% |
| 2020 | 10 | -5.19% | -2.49% |
| 2021 | 2 | -4.85% | 2.78% |
| 2015 | 8 | -4.53% | -6.10% |
| 2009 | 1 | -4.53% | -8.21% |
| 1999 | 5 | -4.48% | -2.29% |
| 2008 | 11 | -4.37% | -6.96% |
| 2002 | 6 | -4.37% | -7.38% |
| 2000 | 7 | -4.34% | -1.63% |
| 2000 | 2 | -4.32% | -1.57% |
| 2002 | 9 | -4.12% | -10.49% |
| 1999 | 12 | -4.04% | 5.63% |
| 2013 | 8 | -4.00% | -3.00% |
| 1999 | 1 | -3.99% | 3.52% |
| 2016 | 10 | -3.98% | -1.73% |
| 2014 | 7 | -3.78% | -1.34% |
| 2008 | 6 | -3.77% | -8.35% |
| 2023 | 10 | -3.57% | -2.17% |
| 2022 | 6 | -3.53% | -8.25% |
| 1999 | 9 | -3.51% | -2.24% |
| Average | -5.59% | -4.86% | |
| Median | -4.69% | -5.06% |
(Source: Portfolio Visualizer)
In the 10% worst months for these aristocrats, they fell as much as the market.
In other words, all investing involves probability curves. With these ultra-low-volatility aristocrats, there is a 10% historical chance they will fall as much as the S&P in any given month.
There is a 0.6% historical chance that they will fall more than the S&P in any given month.
Bottom Line: Low Volatility High-Yield Aristocrats Are A Great Way To Ride Out This Market Storm
There are no certainties in finance, just probability curves. But for anyone who understands smart investing, then ultra-low volatility, high-yield aristocrats like these could be the ticket in this market downturn.
If the market is close to the bottom, they offer a 17% upside in the next year and an attractive and very low-risk income.
And if the bear market is on the horizon, they will help you ride over that market pothole in a Rolls-Royce portfolio.
- Goldman 12-month recession risk: 25%
- Moody’s: 33%
- JPMorgan: 35%
Be the first to comment